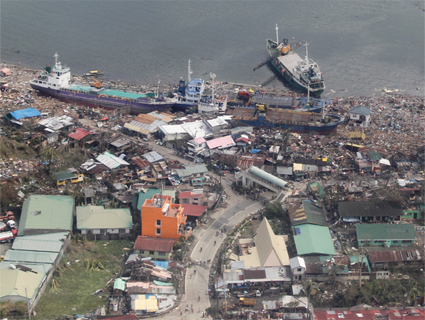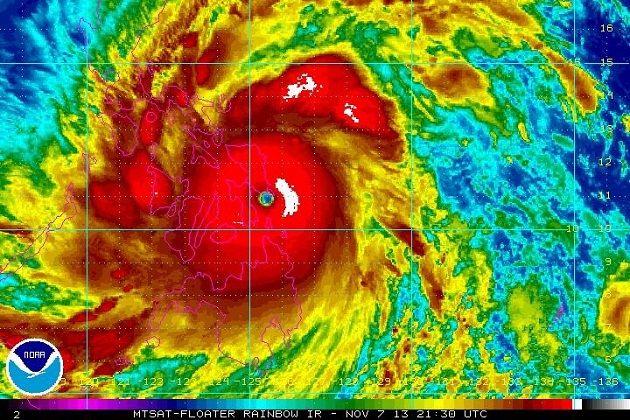
Super Typhoon Haiyan as it made landfall in the Philippines<A href="https://twitter.com/NOAA/status/398576196796964864/photo/1">NOAA</a>
Earlier this month, Super Typhoon Haiyan stunned the meteorological community. The Navy’s Joint Typhoon Warning Center, which tracked the storm, estimated its maximum one-minute sustained wind speeds at more than 195 miles per hour based on satellite imagery. If confirmed, that would exceed the official wind speed estimates for all other hurricanes and typhoons in the modern period. (Prior to 1969, some Pacific storms were recorded as stronger, but these measurements are now considered too high.)
But here’s the thing: Haiyan isn’t the globe’s only record-breaking hurricane in recent years. Even as scientists continue to study and debate whether global warming is making hurricanes worse, hurricanes have continued to set new intensity records. Indeed, a Climate Desk analysis of official hurricane records finds that many of the globe’s hurricane basins—including the Atlantic, the Northwest Pacific, the North Indian, the South Indian, and the South Pacific—have witnessed (or, in the case of Haiyan and the Northwest Pacific, arguably witnessed) some type of new hurricane intensity record since the year 2000. What’s more, a few regions that aren’t usually considered major hurricane basins have also seen mammoth storms of late.
At the outset, we need an important caveat. Due to a number of well-known problems with our hurricane data—including discrepancies in how different meteorological agencies estimate storm strength, as well as major technological changes over time in how storms are measured—we can’t simply leap to the conclusion that global warming is behind these records. That requires further discussion. But first, just consider the records themselves:
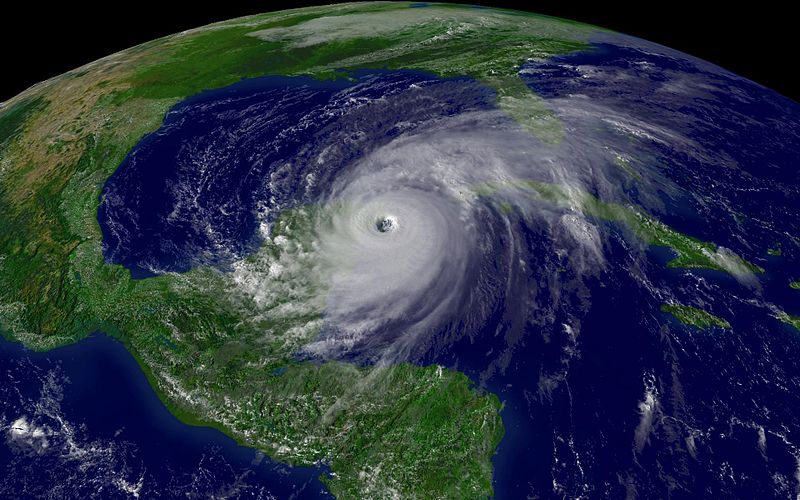
The Atlantic Basin: The Atlantic region—which encompasses the Caribbean Sea and Gulf of Mexico as well as the open Atlantic north of the equator—is the best studied hurricane basin on Earth, thanks to the work of the Miami-based National Hurricane Center. And here, a particularly breathtaking hurricane intensity record came during the devastating 2005 season with Hurricane Wilma, whose minimum central pressure plummeted to a stunning 882 millibars, the lowest ever measured in this basin, on October 19. Atmospheric pressure is one key way of measuring hurricane strength because air rushes inward toward regions of low pressure, meaning that lower pressures generally lead to higher wind speeds. Indeed, when Wilma hit 882 millibars, the National Climatic Data Center quickly pronounced the storm “the most intense hurricane on record in the Atlantic.”
And that’s not Wilma’s only record. On its way to category 5 strength, Wilma also had a rate of intensification that was off the charts. As the Hurricane Center writes: “Wilma’s deepening rate over the northwestern Caribbean Sea, from late on 18 October to early on 19 October, was incredible.” The storm’s 6-hour, 12-hour, and 24-hour pressure drops were “by far the largest in the available records for these periods going back to 1851.” Basically, Wilma went from a tropical storm to a category 5 hurricane in just 24 hours.
All of that said, Wilma didn’t set this basin’s record for wind speed. The record is shared by 1969’s Hurricane Camille and 1980’s Hurricane Allen, both of which had maximum sustained winds of 190 miles per hour.
The South Pacific Basin: Cyclones, as they’re called in many parts of the world, occur in a wide stretch south of the equator from the southwestern Indian Ocean off the coast of Africa all the way to the waters surrounding the islands of the South Pacific. Accordingly, the Southern Hemisphere is often divided up into two hurricane basins, the South Indian and the South Pacific.
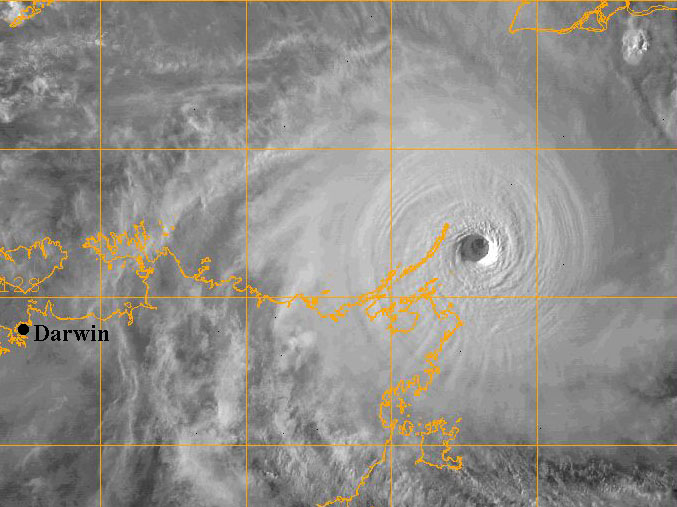
In the South Pacific, it’s pretty clear that the strongest storm on record has occurred since the year 2000, although there’s a virtual tie between two storms: 2002-03’s Cyclone Zoe, which devastated the small Pacific island of Tikopia, and Cyclone Monica, which struck Australia’s Northern Territory in April 2006. Estimates vary across different forecasting agencies on the strength of these two storms (something all too common once you venture outside of the Atlantic region). But if you trust the Navy’s Joint Typhoon Warning Center (JTWC), then both had maximum winds of nearly 180 miles per hour. In addition, Zoe had a minimum central pressure of 890 millibars, according to forecasters at the Fiji Meteorological Service.
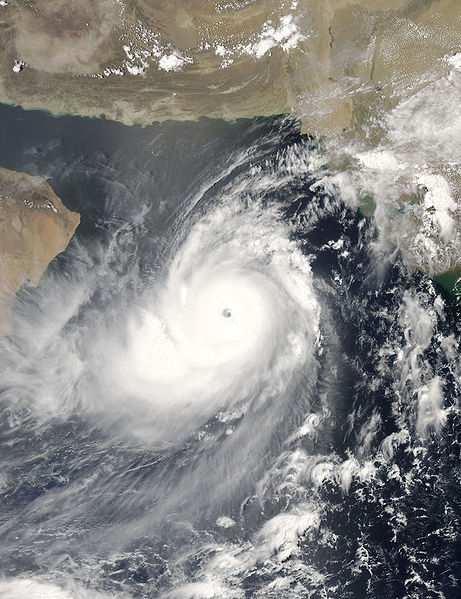
The North Indian Basin: The North Indian basin encompasses the Indian Ocean north of the equator (including the Bay of Bengal) and the Arabian Sea. It has long been home to the deadliest cyclones on Earth: storms like the 1970 Bhola cyclone that struck East Pakistan (now Bangladesh) and killed more than 300,000 people.
When it comes to the Arabian Sea, its strongest storm on record is 2007’s Cyclone Gonu, which sported 167 mph winds, according to the JTWC. Gonu traveled as far northwest as Oman, where its landfall caused 49 deaths and $4 billion in damage. It then made a second landfall in Iran.
What’s more ambiguous is whether Gonu is the strongest storm for the North Indian basin as a whole. According to the JTWC, it is. But according to the Indian Meteorological Department in New Delhi, the deadly 1999 Odisha Cyclone, which may have killed as many as 10,000 people when it struck the Indian state of Odisha, holds that record.
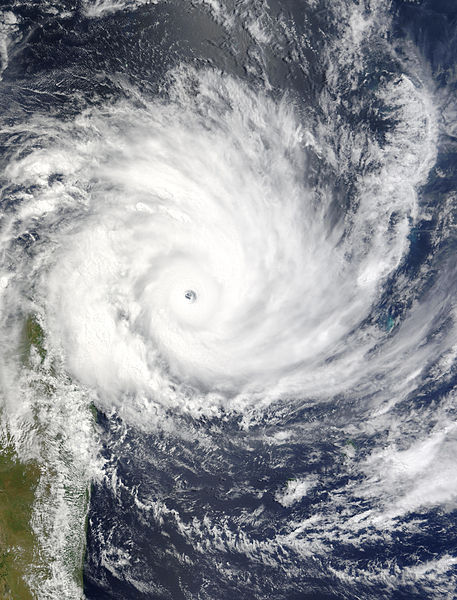
The South Indian Basin: Perhaps the most confusing basin to analyze is the South Indian, where one key intensity record was set in 2004 by Cyclone Gafilo, an extremely intense storm whose pressure was estimated at 895 millibars by forecasters in Réunion, an island east of Madagascar. That’s the lowest pressure on record for this basin reported by any forecasting agency. However, three different forecasting offices give different answers for which storm was the strongest by wind speed, leaving no clear answer. Gafilo, at any rate, was quite a monster. The storm struck Madagascar at full category 5 strength, leaving hundreds of thousands homeless in its wake.
But that’s not all. There are also some other regions that get hurricanes less frequently (or, aren’t supposed to get them at all) that have set eyebrow-raising records recently:
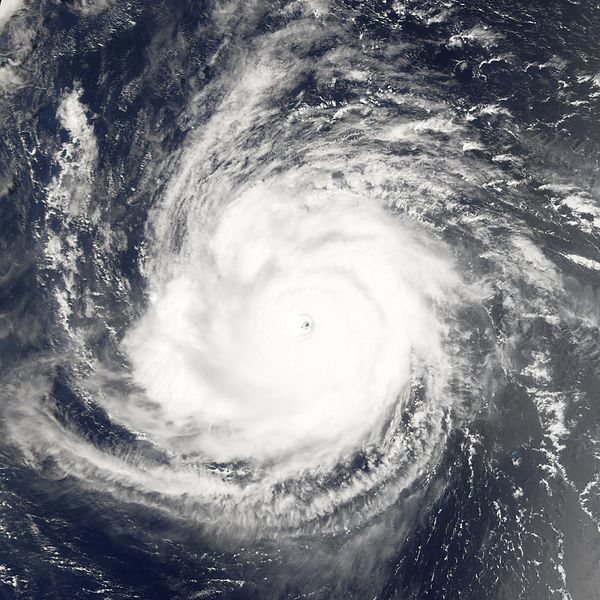
The Central Pacific: In the Central Pacific region near Hawaii, only a few tropical cyclones are usually seen each year, and for this reason the Central Pacific is not usually counted as an “official” hurricane basin. There are still more than enough storms for the National Weather Service to operate a Central Pacific Hurricane Center, however—and its jurisdiction, too, recently saw a dramatic new record. In 2006, Hurricane Ioke rampaged across the Central Pacific and traveled all the way into the Western North Pacific, where it was officially pronounced a typhoon (which is simply what hurricanes are called in this region). According to the Central Pacific Hurricane Center, Ioke had “the lowest estimated surface pressure for any hurricane within the central Pacific” at 900 millibars, and it set another stunning record to boot. Ioke lasted at category 4 strength, or higher, for 198 hours straight, “the longest continuous time period at that intensity observed for any tropical cyclone anywhere on earth.” If you define hurricane intensity as the total amount of time spent as a very strong storm, then Ioke beats all the rest.
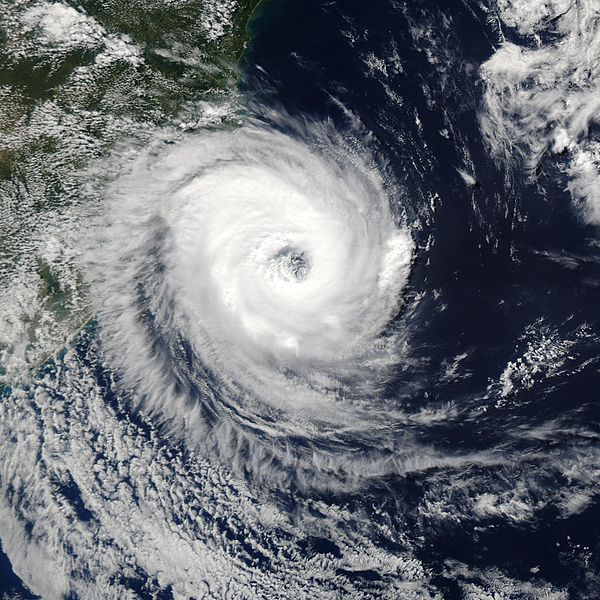
South Atlantic: And if you think that’s striking, just wait for the next record. The region of the Atlantic south of the equator isn’t supposed to get hurricanes at all. In 2004, though, it broke all the rules and served one up.
Cyclone Catarina, which was the equivalent of a category 1 hurricane in strength, was named after the site of its landfall, the Brazilian state of Santa Catarina. While Catarina constituted a major anomaly, one published scientific analysis suggested it might also be a harbinger. “Other possible future South Atlantic hurricanes could be more likely to occur under global warming conditions,” suggested the researchers.
To be sure, not every hurricane basin in the world has set a clear record in the last decade. But even here, you only have to go back a few years further to find a record:
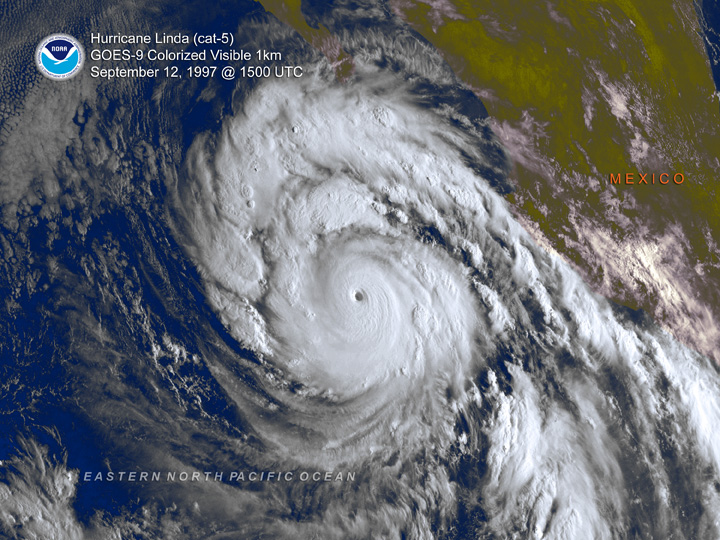
The Northeast Pacific Basin: The US National Hurricane Center also monitors storms that occur in the tropical Pacific off the western coast of Mexico and Central America. Here, the strongest storm was 1997’s Hurricane Linda, which rapidly intensified south of the Baja California peninsula in mid-September of that year. With 184 mile per hour maximum winds and a minimum central pressure of 902 millibars, Linda was stunning, although the storm never actually hit land. For a while, though, there were concerns that Linda might travel northward far enough to threaten Southern California.
So what does it all mean? Such are the records, and now the question becomes: What exactly is their significance?
Before rushing to the conclusion that “it’s global warming,” there are some key caveats.
First, a “record” is, by definition, merely what has been recorded. We don’t know what hurricanes were like 1,000 years ago, or even 200 years ago, before we were carefully documenting their characteristics.
Second, some “records” are more likely to be records than others. That’s because our hurricane data just aren’t as good in other parts of the world as they are in the Atlantic. If there’s an intense hurricane off US shores, you can bet there are hurricane hunter planes in it taking direct measurements of wind speeds and pressure. Yet in other regions, storm intensities are largely estimated based on infrared satellite images, a less reliable technique. And then there’s a basin like the Northwest Pacific, where the Navy used to fly research flights into storms, but stopped back in 1987. “We’re just not measuring these storms at all well,” explains MIT hurricane expert Kerry Emanuel.
Finally, there have also been major technological changes over time in how we observe storms. “Geostationary satellites have only been around since the late 70s,” explains Jim Kossin, a hurricane expert at the National Climatic Data Center, meaning that “if a storm is as intense as Haiyan was, it’s much more likely now for us to be able to measure that than it was 30 years ago.” This implies a bias towards stronger storm measurements over time.
So when you see lots of storm records being set recently, it is important to keep in mind that much of this may be simply due to better measurements and better observations. And yet at the same time, one recent scientific paper that explicitly controlled for these changing measurement systems found a global shift towards more category 4 and 5 storms, and fewer Category 1s and 2s, a trend correlated with climate change. If the strongest cyclones are occurring more frequently, says study author Greg Holland of the National Center for Atmospheric Research, then breaking records makes sense. “If there’s more of them, statistics say you’re going to break more records,” Holland says.
The science of hurricanes and global warming remains highly contested, however, and we must wait for scientists to sort it all out. In the meantime, keep an eye out for more hurricane records.
Additional reporting by Matt Connolly.