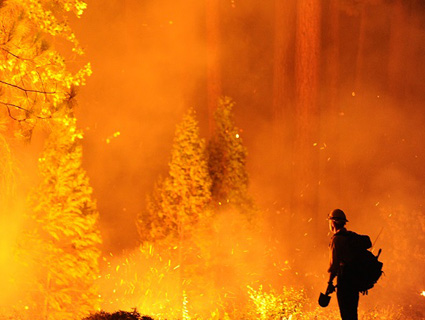
<a href="http://www.flickr.com/photos/akasped/11808898455/sizes/z/">akasped</a>/Flickr
This story first appeared in The Atlantic and is republished here as part of the Climate Desk collaboration.
Talking about the weather used to be a euphemism for not talking about anything at all.
No matter how many times scientists tell us that weather isn’t climate, the day-to-day weather sure does remind us of the long-term trends that together form the climate.
Is the unseasonably warm, dry weather we’re having in California a pleasant occasion for pleasantries or an impending sign of planetary doom? Maybe both.
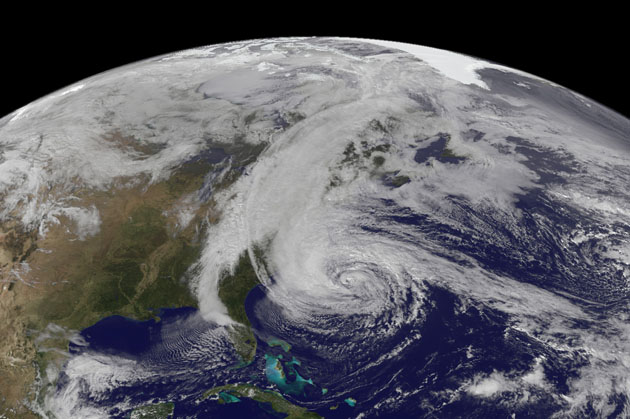
The same goes for hurricanes and polar vortices and any other anomaly. We talk about our strange local weather, but we are also talking about our planet’s future.
And what that means is: Talking about the weather no longer simply requires looking outside or checking the temperature on an app. We need context, long-term trend lines, analysis, and—because why not—also data and maps and webcams and pictures from space.
Here’s how to elevate your weather-talking game with help from @burritojustice, the best Twitter feed for eclectic, unexpected links (especially about the weather and historical mapping).
There are three general types of resources here. First, there are people and institutions that analyze the weather and tell us about them. The second category is unfiltered public weather data and imagery. And the last tranche of resources deliver forecasts or computer models on which forecasts are based.
People and Institutions
The first stop for budding weather nerds is Jeff Masters’ Wunderground blog. This is meteorology, raw and uncut. Masters breaks down newsy weather phenomena better than anyone.
On Twitter, friends swear by @EricHolthaus, a meteorologist who recently joined Slate. Others love Anthony Sagliana, who writes for Accuweather. There are many meteorologists with prominent online presences, like Cliff Mass for the Pacific Northwest/West, the Capital Weather Gang for the DC region, and @phillywx for the Delaware Valley. Check out, for example, Mass’ look at Western snowpack as seen in satellite imagery from 2013 and 2014.
It’s also worth following the regional Twitter accounts that interest you. For example, if you’re interested in tornadoes, the NWS’s Norman, Oklahoma, regional office is a must follow. Or if you follow space launches out of Johnson Space Center, there’s a feed just for you.
During a weather event, these Twitter feeds often present the most interesting Weather Service information in a way that’s easy to access.
If you’re not a Twitter user, they have a variety of ways to receive important alerts. Specific types of weather events tend to have their own web outposts, too. For hurricanes, for example, the National Oceanic and Atmospheric Administration maintains the National Hurricane Center.
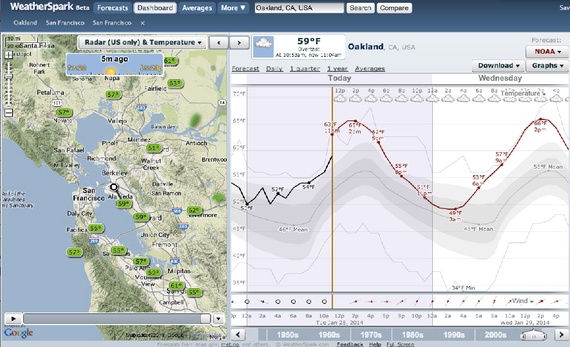
There are also several tools and apps that provide a lot of data all in one place for your local weather. The standard is probably Weather Underground, but there are many sites. Check out, for example, Weatherspark for a detail-rich interface.
But sometimes all that data can be overwhelming. In that case, there are cheeky feeds like @OneWordSFWthr, which provides the San Francisco forecast in one word. Today? Muddled.
And in between these two extremes, there are a variety of apps that try to simplify and beautify the weather experience. Probably the best known is Dark Sky, which has the killer feature of telling you when it’s going to rain just about right where you are.
Weather Data and Imagery
The core resource in this category is, of course, the National Weather Service, which is part of NOAA. You can find all kinds of stuff:
- Radar maps
- River and lake gauge data (to assess flooding)
- Precipitation data
- Air quality readings including ozone, smoke, and dust
- Satellite imagery in the visible and infrared parts of the spectrum
That’s just the beginning, too. Of particular interest, I think, is the Climate Prediction Center, which does longer term analyses. For example, let’s say you wanted to know how anomalous a given temperature was relative to the long-term average of a place. There’s a microsite for temperature anomaly maps.
And there are also:
- Long-term precipitation charts for cities
- Long-term temperature plots for cities
- Long-term trend plots for the country
Among non-governmental websites, the company Unisys posts a variety of weather data. Here’s just a sampling:
- Weather front position maps
- Wind chill maps
- Heat index maps
- Wind streamline maps
- Sea surface temperature maps
- Sea surface temperature anomaly maps
- Individual weather station time-series plots
And there’s a whole set of data about the upper air including temperatures at given atmospheric pressures and heights of certain temperatures. It’s wild. There’s so much.
The data keeps going. NOAA can give you surface temperatures from 9,000 weather stations, some of which have data stretching back to the beginning of the 1900s. In certain local areas, like San Francisco, people have made this history easier to access. Perhaps the coolest of these projects is @datapointed’s look at rainfall patterns in the Bay before and after Valentine’s Day.
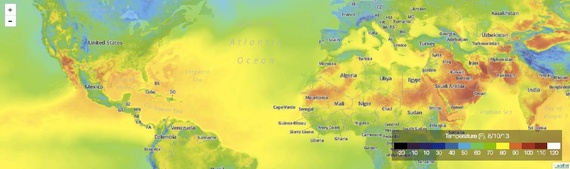
Or if you prefer a more visual interface, Forecast.io brings you Quicksilver:
The metapoint with these last several links is that because weather data is so widely available, there are a lot of people doing interesting things with it.
Forecasts and Models
Weather forecasting has come a long way, in part due to the increasing availability of data and the sophistication of the simulations that forecasters can run. In the section above, we saw data sources, current and historical. In this section, we look at the models and the forecasts they generate.
The National Weather Service creates the Global Forecast System Model, the only one for which all data is available over the Internet. For that reason, most of the weather products you see out there (or in the App Store) are based on NWS data. But just for medium-range global forecasting, there are four other global models. (This is to say nothing of other types of models.)
Each model has been trained with certain types of data and makes certain assumptions. Global models lose some resolution, but they provide ways to understand how various weather patterns interact around earth. More regional models might be able to incorporate more local data, but they might miss out on effects from more planetary forces. Even between global weather models, they might weight some factors more heavily than others.
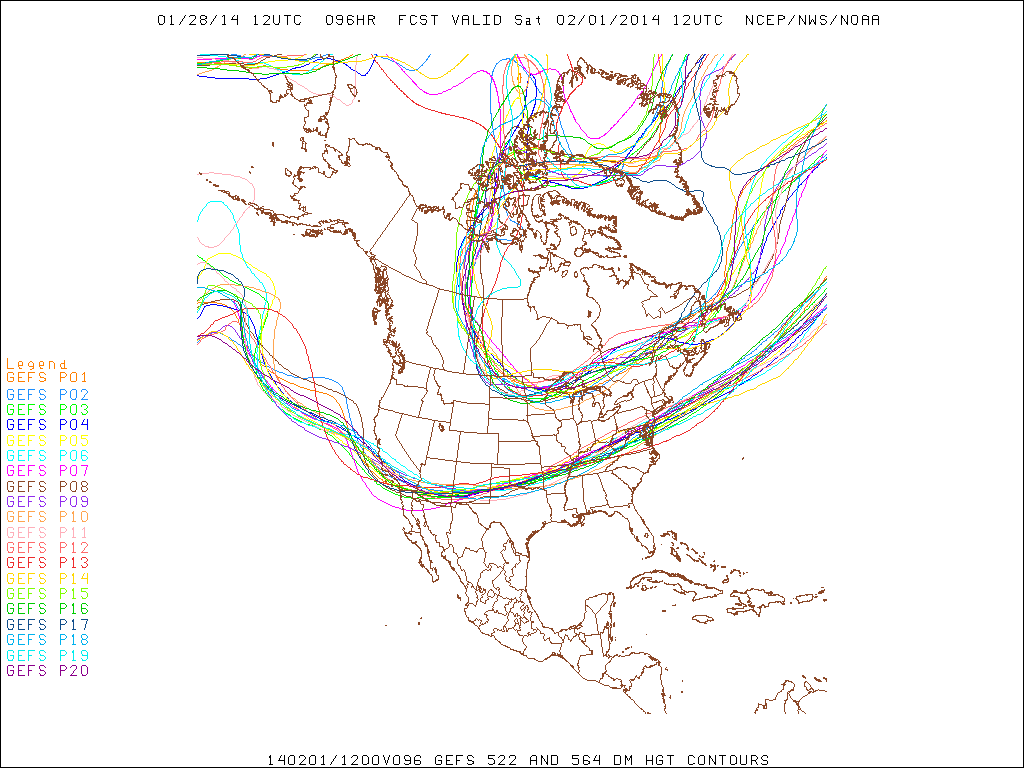
For that reason, forecasters might look at more than one model to understand a given weather phenomenon. Meteorologists can also look at “ensemble” forecasts that combine the output from many different models. The NWS produces the Global Ensemble Forecast System, which is fascinating to look at because one can see the variation that the model runs show between each other. Here’s one run of the model, showing the contour lines for atmospheric pressure at 500mb over North America. Note how in this forecast, which is for Saturday, the lines representing the various models have begun to diverge.
There’s even a probability tool that lets you probe the differences between the models in the GEFS for individual stations!
Now, this is a dense and technical world. It’s a bit beyond the scope of this post or my expertise to lead you through how to effectively test weather predictions with the models that exist.
But, there are three tools for probing models that you should be aware of:
- NOAA’s Model Guidance (With this index)
- Weather Underground‘s simplified model prediction mapping tool
- Unisys’s model exploration tools
All three let you explore the models discussed here as well as the North American Mesoscale Model, Rapid Refresh Model, and the European Centre for Medium-Range Weather Forecasts model.