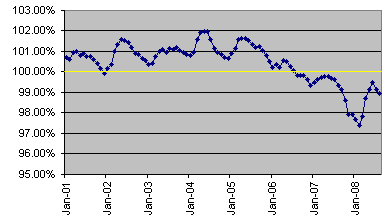
CHART OF THE DAY….Newspaper accounts of housing prices usually provide year-to-year comparisons, which are useful for some purposes but not for others. In particular, if house prices start to stabilize, you won’t see it in the year-to-year charts because prices will still be way below their level from a year ago even if they aren’t dropping any further. “21% below their peak” doesn’t really tell you much about what’s happening now.
For that, you want to see how prices compare to the previous month. Back in August I posted a Case-Shiller chart showing monthly comparisons (through June) that suggested prices might be stabilizing, but with a caveat that this stuff is seasonal and the good news might not hold up. Sure enough, it hasn’t. Here is this month’s chart (with prices through August), and it shows that month-to-month prices are not only still declining, but declining faster than they were earlier in the summer.
The rate of decline is still nowhere near its nadir in February, but this is yet more evidence that we still have a ways to go before housing prices bottom out. And people know it: this month the consumer confidence index fell to 38.0, lower than during the 1974 recession, lower than during the 1980 recession, lower than ever recorded before. And credit card companies are “sharply curtailing” credit lines. And to top it all off, we’re running up an “ecological debt” of $4 trillion per year.
But the stock market is up! Why? Apparently because investors are looking forward to the Fed cutting interest rates tomorrow. Sure, the Fed is only contemplating this because the signs of recession are so bleak, and it’s unlikely that interest rate cuts will have much of an effect anyway, but who ever said Wall Street investors were smart?


