Via Andrew Sullivan, Mike at No Empty Wallets wants to know why I think home prices have another 20% to fall. It’s nothing complicated. The most widely accepted barometer of home prices is the Case-Shiller home price index, which canvasses housing prices in 20 cities. Here’s the raw data.
Case-Shiller was at 150 in December 2008. The GDP price deflator stood at 123. So the inflation-adjusted value of Case-Shiller was about 122.
 In January 2000, when home prices were near their historical trend levels, Case-Shiller stood at 100. The GDP deflator stood at 99. So the inflation-adjusted value of Case-Shiller was about 101.
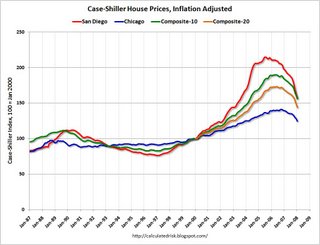
My arithmetic is pretty simple: getting from 122 back to 101 is about a 20% drop. (The chart on the right, from Calculated Risk, is a year old, but even so it gets the same point across for the graphically minded. The orange line is the 20-city index. It’s fallen 20% in the past year, and looks to have another 20% to go before it reaches pre-bubble trend levels.)
Actually, it’s worth noting that I’m being a little generous here, since in a recession values often overshoot on the way down. Mike suggests that lower mortgage rates and the upcoming stimulus tax credit will prop up prices a bit compared to past levels, and that’s possible. But mortgage rates are only slightly lower today than in 2000, and the effect of the tax credit is hard to judge. I’m just guessing like everyone else (and since I have a house I’m trying to sell I’d be delighted to end up wrong about this) but I’d keep my money on a further 20% drop. We still have a fair bit of recession ahead of us.


