 This is a cool chart. Using a fairly slick technique, Boris Shor and Nolan McCarty have come up with a way of comparing state parties on a common ideological scale. Andrew Gelman explains:
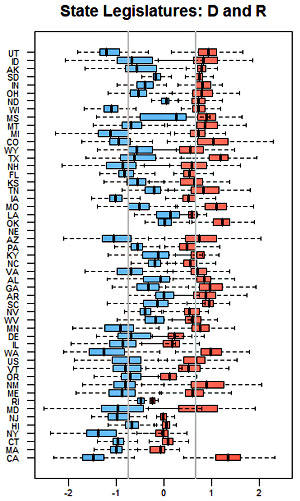
The estimates are based on state legislative voting, which might make you wonder how you could possibly compare legislators in one state with those in another. The trick is that some state representatives (for example, Barack Obama) also end up in Congress. There are enough of these overlap cases that you can put legislators from all 50 states on a common scale.
It’s not clear how the states are ranked, but if you look hard enough you’ll see that California is at the bottom. This is appropriate. In fact, the chart goes a long way toward explaining why the Golden State sucks so bad these days: we have both the most liberal Democratic Party and the most conservative Republican Party. The state GOP, in particular, is way more conservative than any of its peers, beating out even Texas and Oklahoma by a sizable margin.
The error bars are pretty big here, so take all of this with a grain of salt. Still, it demonstrates pretty vividly that California really is two states. Not North/South, but Coastal/Inland. They’re practically different countries.