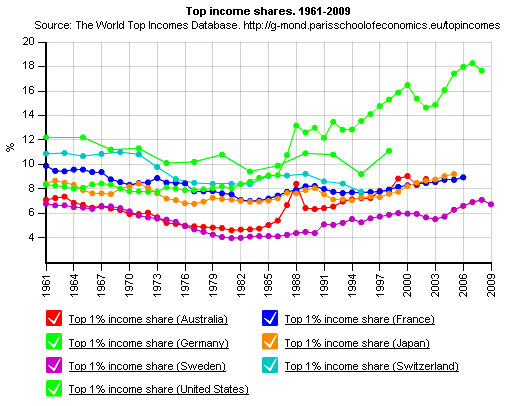
Via Felix Salmon, here’s a fun new tool to play around with: the World Top Incomes Database. For example, here’s a chart showing how the top 1% are doing in America vs. six other rich economies from around the world. Pretty good job, rich Americans!
You can create your own charts too. Just click here and then click on “Graphics.” It’s fun for the whole family — assuming your family is really wealthy, anyway. For the rest of us, at least it’s free.


