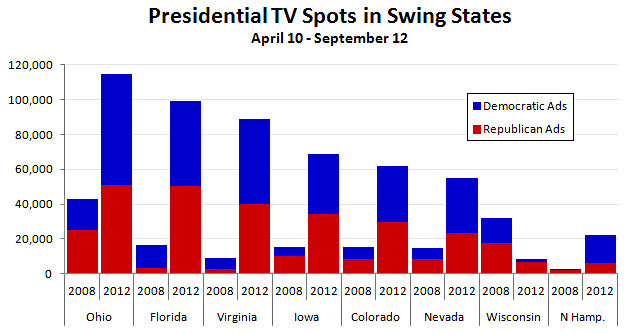
Via Andrew Sullivan, the chart below compares TV ad buys for the presidential contests of 2008 and 2012. The raw data comes from Kantar Media’s Campaign Media Analysis Group, as reported by Elizabeth Wilner of Advertising Age. The big takeaway is that 2012 spending in battleground states is running at about three times its 2008 level. Based on past patterns, Wilner figures this means that the two campaigns will be airing about 43,000 ads per day for the rest of the election cycle.
And that’s just presidential ads. It doesn’t count Senate races, congressional races, ballot measures, or state races. This is just Obama vs. Romney.
The other big takeaway is the difference in strategy between the two campaigns. Up to now, their ad buys have been about even. But that’s going to change as the Romney campaign — aided by oceans of outside money — ramps up its spending:
The Obama campaign has seen this contest as a seven-month run, while the Romney campaign has seen it as a three-month sprint. Team O. has bet a few hundred million advertising dollars on winning by undercutting Romney’s candidacy before the airwaves become completely saturated and September and October ads start reaping diminishing returns.
….The Romney campaign is betting on total saturation this fall to persuade voters that the country can’t afford another four years with Obama in charge of the economy….As we enter this eight-week ad whiteout, whichever campaign has made the right bet will win the presidency.
Fasten your seat belts. Especially if you live in Ohio.