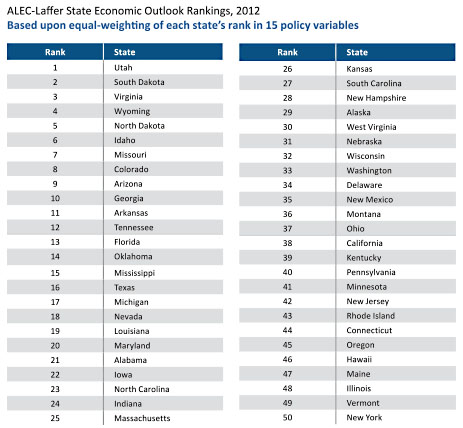
I guess today is the day for either catastrophic news (sea levels rising faster than we thought, GDP growth worse than we thought) or else political news that just makes me laugh. Earlier this morning I passed along the comical news that Republicans refuse to tell anyone what entitlement cuts they allegedly want to make, and now I learn from MoJo‘s own Erika Eichelberger that our good friends at ALEC have finally gotten the comeuppance they  deserve. ALEC is a conservative group that writes model bills for friendly state legislatures, and although they sometimes branch out into things like voter ID laws, most of their focus is on anti-tax and anti-labor bills.
Every year they write a report extolling the virtues of their work and ranking all 50 states by how slavishly they follow ALEC’s recommendations. But they mostly use statistical comparisons that would embarrass an eighth-grader. They cherry pick, showing the performance of one particular state vs. another. They show only the top seven, or nine, or five states compared to the bottom seven, or nine, or five. They weight every state equally, so big growth in tiny states counts as much as sluggish growth in big states. And guess what? Using their carefully invented measures, states with high ALEC scores always turn out to perform better than states with low ALEC scores. Amazing!
Well, this year someone finally called their bluff and simply produced a bog-ordinary scatterplot that compared ALEC scores vs. economic performance for all 50 states. And guess what? It turns out that high ALEC scores are correlated with negative employment growth, negative income growth, negative government revenue growth, and no difference in state GDP growth. Erika has all the charts here. Enjoy.


