Via Steve Benen, I see that we have a new study from MIT political science professor Charles Stewart about waiting times to vote in the 2012 election. Two factors seem to play the biggest roles in wait times: where you live and where you live. Of the ten places with the longest waits, nine are southern or 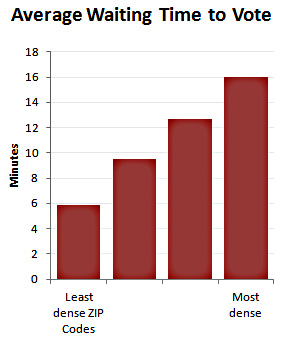 border states.1 And within states, areas with dense populations have the highest wait times. Here’s the net result:
At the individual level, the factor that stands out is race. Viewed nationally, African Americans waited an average of 23 minutes to vote, compared to 12 minutes for whites; Hispanics waited 19 minutes.
While there are other individual-level demographic difference present in the responses, none stands out as much as race. For instance, the average wait time among those with household incomes less than $30,000 was 12 minutes, compared to 14 minutes for those in households with incomes greater than $100,000. Strong Democrats waited an average of 16 minutes, compared to an average of 11 minutes for strong Republicans.
Is this racial disparity deliberate? It’s impossible to say. But it’s there; it’s been there for a long time; and no one seems to be in much of a hurry to fix it. I report, you decide.
1Tennessee, Louisiana, Georgia, Oklahoma, Michigan, South Carolina, Virginia, Washington DC, Maryland, and Florida. And yes, I know that Washington DC isn’t actually a state.


