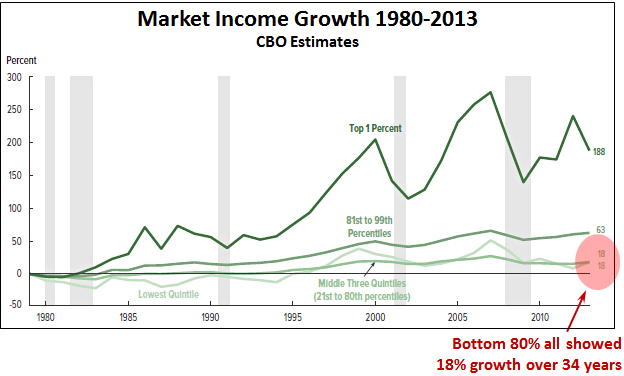
I commented briefly yesterday on the CBO’s latest report about the distribution of household income, but I didn’t get a chance to show you the main event: Income growth since the Reagan era. Here it is:
The nice thing about the CBO income estimates is that they’re pretty comprehensive. This one, for example, shows market income, which consists of labor income (including cash wages, health insurance, and the employer’s share of Social Security, Medicare, and federal unemployment insurance payroll taxes), business income, capital income (including capital gains), and retirement income. Other CBO income measures include government transfers, so you can get a good sense of how incomes are affected by social welfare programs.
As you can see, the market incomes of the rich bounce up and down a fair amount because they rely on volatile income sources like stocks and other investments. 2013 was not a good year for them—though we already know that they made up some of this ground in 2014 and 2015.
But for the unrich—which is, roughly speaking, everyone making less than $100,000 per year—nothing ever changes. During a period when real GDP per capita increased 77 percent, the income of the unrich has increased only 18 percent. That’s about half a percent per year, and all of it came from a single decade: 1993-2003. The rest of the time there’s been literally zero growth in the income of the unrich.
Economic anxiety may not be the real motivation for angry voters in this election, but it sure ought to be.