The Census Bureau dropped a second report today, their annual look at the health insurance rate. This is less interesting than the income and poverty report since 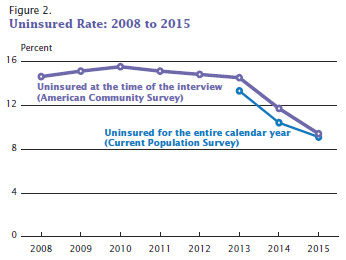 we already know a lot about the level of health insurance coverage from other sources. Still, the Census provides high-quality data, so it’s worth taking a look at. Unsurprisingly, the number of uninsured was down:
In 2015, 9.1 percent of people (or 29.0 million) were uninsured for the entire calendar year. This was a decrease of 1.3 percentage points from 2014, when 10.4 percent (or 33.0 million) were uninsured for the entire calendar year.
(Note that this number includes the entire population, including the elderly. This is why it’s lower than the CDC numbers I’ve reported before, which include only people under age 65.)
Say what you will about Obamacare, but it’s been astonishingly effective at doing what it set out to do. The Census estimates that 18 million more people have health insurance today than in 2013.
But there’s more here than just raw numbers. Obamacare has done better in some states than others, because too many states continue to hold out against Medicaid expansion:
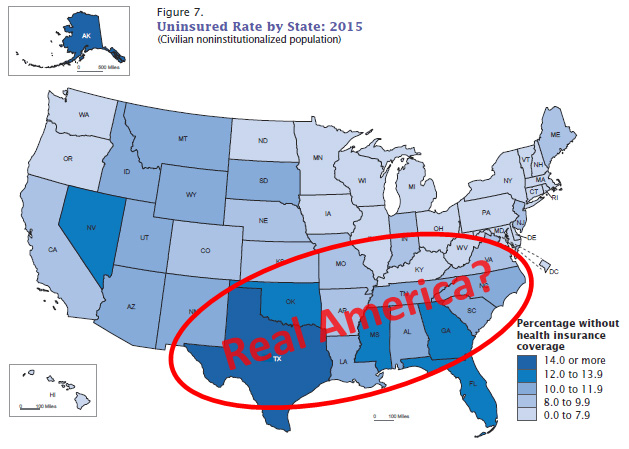
In places like California and New York, the uninsured rate is below 8 percent. But in places like Texas and Florida, which would cut off their collective big toes before they’d allow an Obama program to help their poor, the uninsured rate is 12 percent or higher. The next chart tells the story:
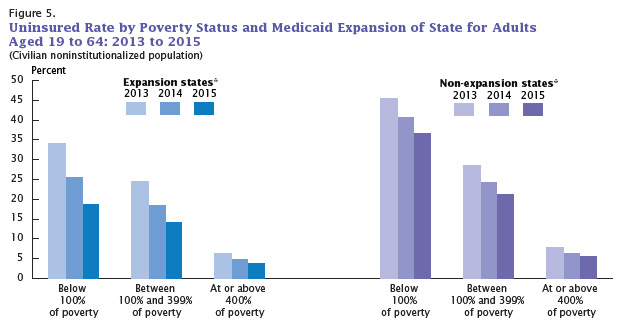
Medicare expansion states have lower rates of uninsurance and bigger drops in uninsurance since Obamacare started up. The non-expansion states could help their own residents with the stroke of a pen, but most of them continue to refuse. It gives spite a whole a new meaning.


