Here’s a fascinating little chart courtesy of Thomas Forth. It shows income inequality in the UK (on the vertical axis) vs. growth in disposable income (horizontal axis). Here it is for the poor:
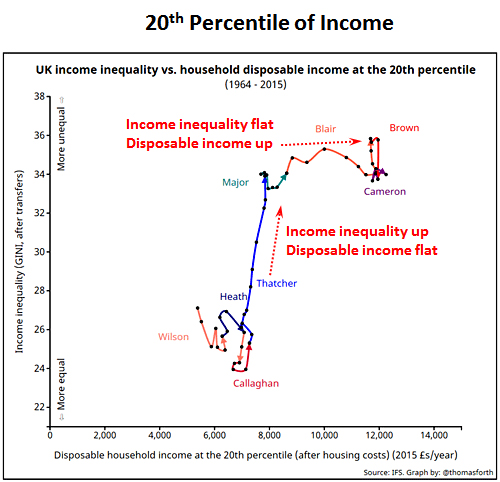
In the go-go 80s under Thatcher, the poor made no progress at all. Under Blair, their disposable income increased from about £9,000 to £12,000. But what about the well-off? They probably did great under Thatcher and then got the shaft under Blair. Let’s look:
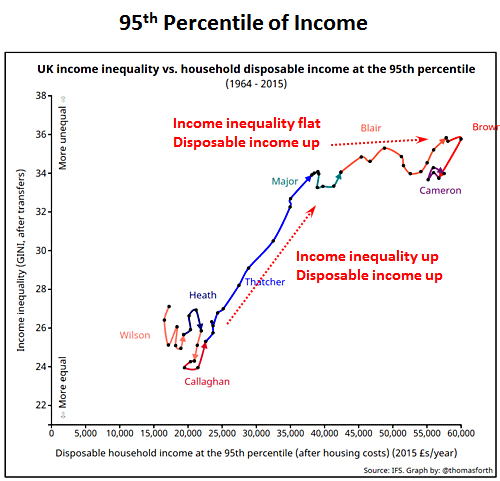
Under Thatcher, the well-off did indeed prosper. Incomes of the 95th percentile went up from £23,000 to £37,000. Under Blair they went up from £42,000 to £58,000.
So under Thatcher the poor got nothing and the well-off saw their incomes rise by about 60 percent. Under Blair, the poor did pretty well and the well-off saw their incomes rise by about 40 percent. Choose which country you’d rather live in.