The Bureau of Labor Statistics has released its latest figures for total job openings, and nothing much changed since December. But it’s still a good excuse to show you a chart of the total number of unemployed per job opening, which is a good indicator of labor market tightness. However, in order to count all the unemployed and underemployed, I’m using the U6 measure of unemployment:
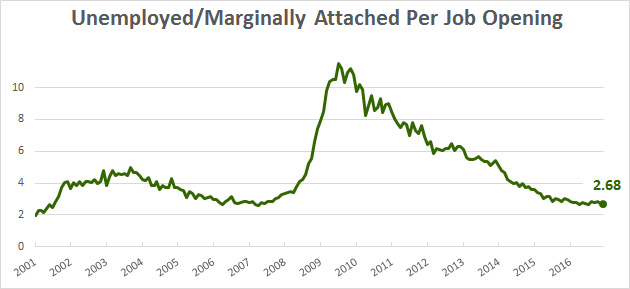
We’re not quite at dotcom boom levels, but we are at housing bubble levels. The number of unemployed people per job opening is now down to about the same level as 2006-07, the height of the last economic expansion. Obviously different industries have different problems, but overall this means that companies really are having trouble finding workers when a job opens up.
Despite this, and despite other indications that the labor market is starting to tighten, one measure remains an outlier: wages. They’ve gone up over the past couple of years, but only slowly. This is the ultimate test of labor market tightness: if companies are really having trouble finding people, they’ll increase wages to attract more job applicants. So far, that’s not really happening. It’s a little bit mysterious.