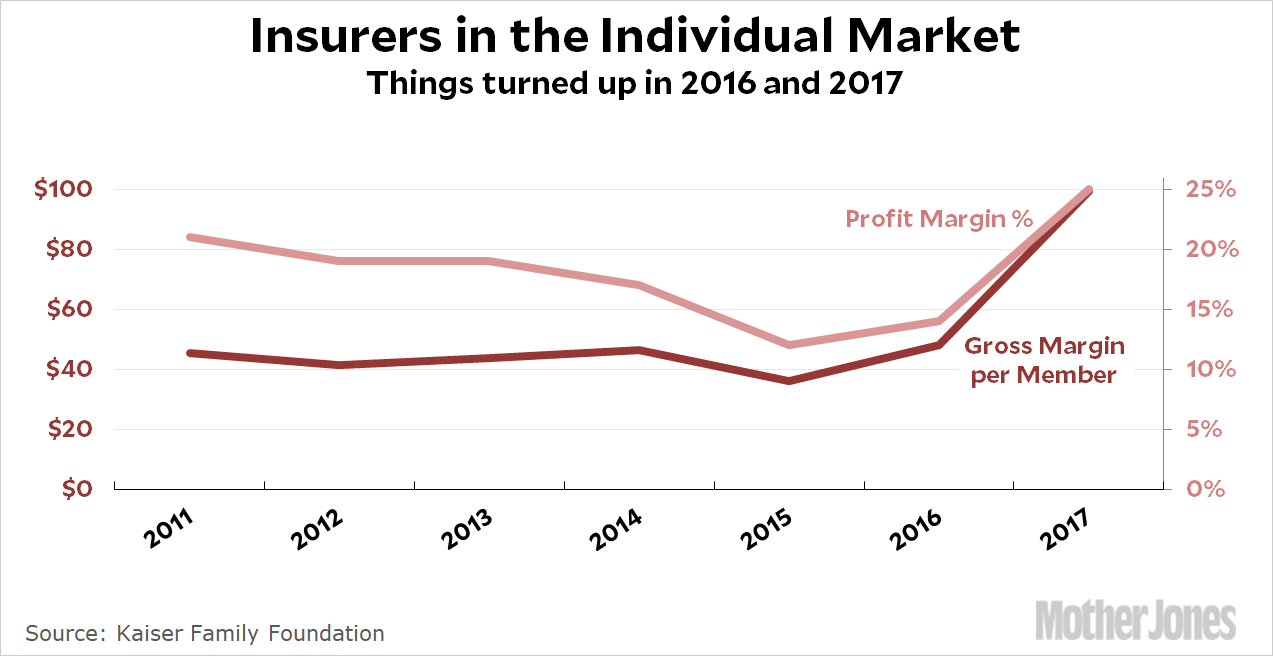
Michael Hiltzik points me to some new data from the Kaiser Family Foundation about Obamacare. A picture is worth a thousand words, so here’s a chart that shows how insurers are doing in the individual insurance market:

This is the result of the big increase in premiums in 2016. Claims went up only 5 percent, a little less than normal, but average premiums went up 20 percent. The result is a big increase in gross profits per customer and a big increase in overall profit margins. This is pretty much what most analysts predicted: insurers lowballed their premiums in 2013 and saw their profit margins fall over the next two years. That improved a bit in 2016, and then improved a lot in 2017 following the large premium increases.
In other words, the big premium increases of last year weren’t a sign of Obamacare failing. They were a sign that insurers had learned more about the market and needed a one-time increase to return themselves to profitability. If there’s another big premium increase this year, it won’t be because nobody is making money in the Obamacare market. It will be due to deliberate destabilization of the market by Donald Trump and congressional Republicans.
However, there’s a downside in this data: Obamacare has attracted a sicker pool of customers. Between 2011 and 2014, average hospital days increased about 1.8 percent per year. Since then, they’ve increased 4.6 percent per year. This isn’t surprising since Obamacare required insurers to cover everyone, not just the healthy, but it does indicate that insurers really are dealing with a more expensive set of customers and needed a few years to figure just how much more expensive they were going to be.
Note that all of this data is from the first quarter of 2017, and is being compared to the first quarter of previous years. Apples to apples. Obviously we’ll have to wait six months to get full-year data through 2017.


