Let’s just finish up with all the charts I have today, OK? Then I’ll go to lunch, and maybe I’ll come back with some ideas for less analytical posts.
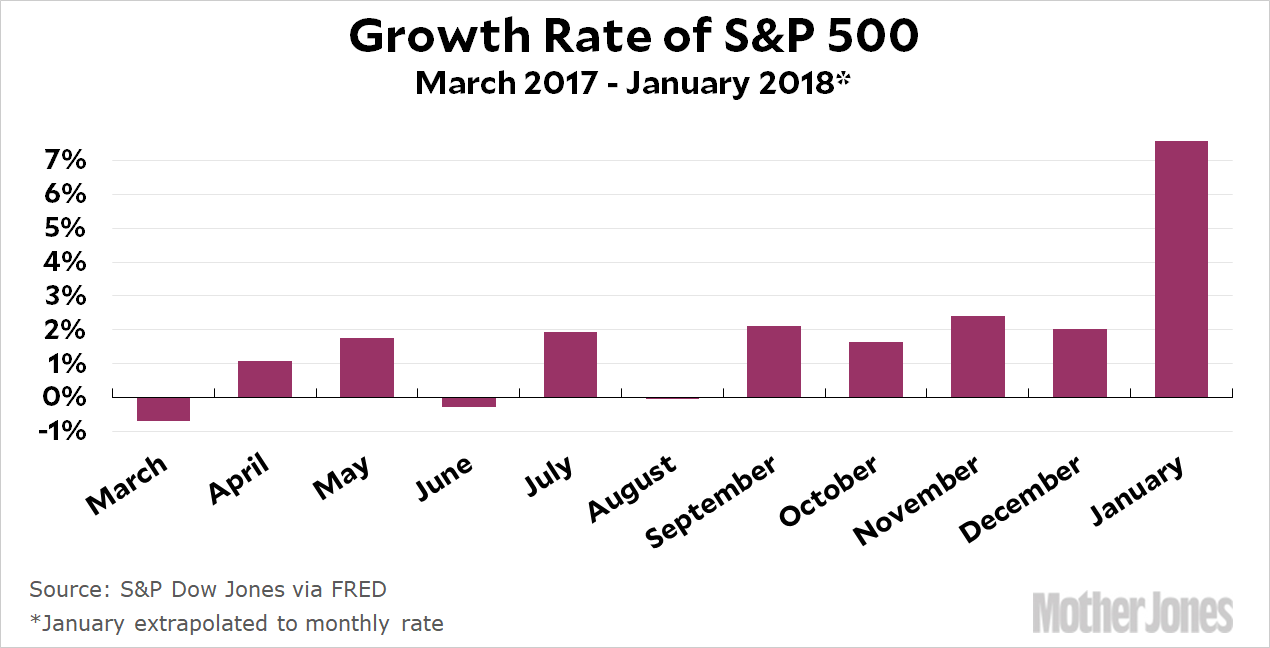
The stock market has gone crackers this month. Here’s the growth rate of the S&P 500 for the past year, with the first two weeks of January extrapolated to a monthly rate:

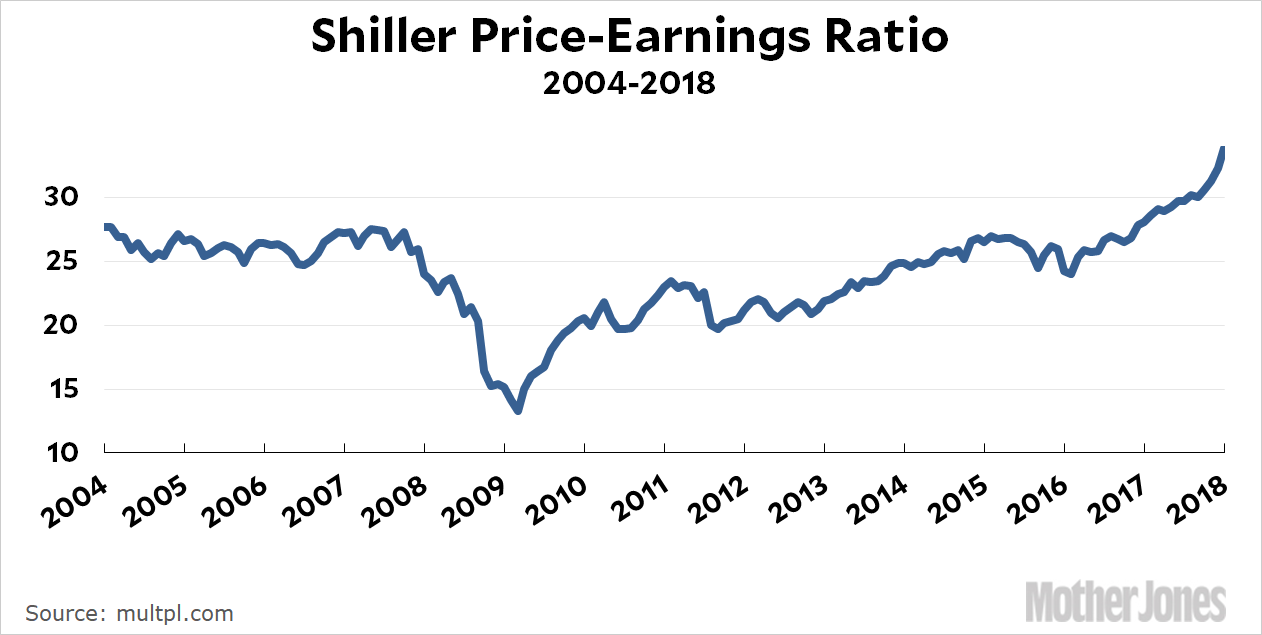
Hmmm. And here’s the Shiller PE ratio, which uses 10-year inflation-adjusted earnings:

It’s currently at about 34, which is lower than it was at the height of the dotcom bubble, but higher than Black Tuesday of 1929, the height of the 1960s bull market, Black Monday of 1989, and the height of the housing bubble. Is it too high? I guess that’s for each one of us to decide.


