Conventional wisdom says that we baby boomers have gotten all the goodies and left nothing for future generations. Today, the Wall Street Journal says this isn’t true: boomers in their golden years are totally screwed—and they present boomer retirement in apocalyptic terms:
Americans entering retirement are in worse financial shape than the prior generation, for the first time since Harry Truman was president…. median incomes [] haven’t risen…. high average debt…. paltry 401(k) retirement funds…. 40% of households headed by people aged 55 through 70 lack sufficient resources to maintain their living standard in retirement…. Things are likely to get worse…. Individuals will find themselves staying on the job past 70 or taking menial jobs as senior citizens…. portends a drain on public resources…. “This generation,” said Alicia Munnell, director of the Boston College Center for Retirement Research, “was left on their own like no other generation before.”
The Journal has a few anecdotes from struggling seniors, along with a scattering of charts from a bunch of different sources. But most of the charts don’t directly tell you anything about boomer retirement. I’m here to fill the gap. The following charts come from the Social Security Administration’s MINT model, which is detailed and highly respected. It’s probably the most comprehensive retirement model in existence, and includes virtually every type of income. You can read the whole thing here. All my data comes from Tables A8-1a through A8-12a, starting on page VIII-33. I used these tables because they were the only ones that broke out their figures by decade. Note that the current boomer generation is the one retiring in 2015-25, which I abbreviated to 2015.
First off, here’s the MINT projection for the number of people who will retire by age 65:
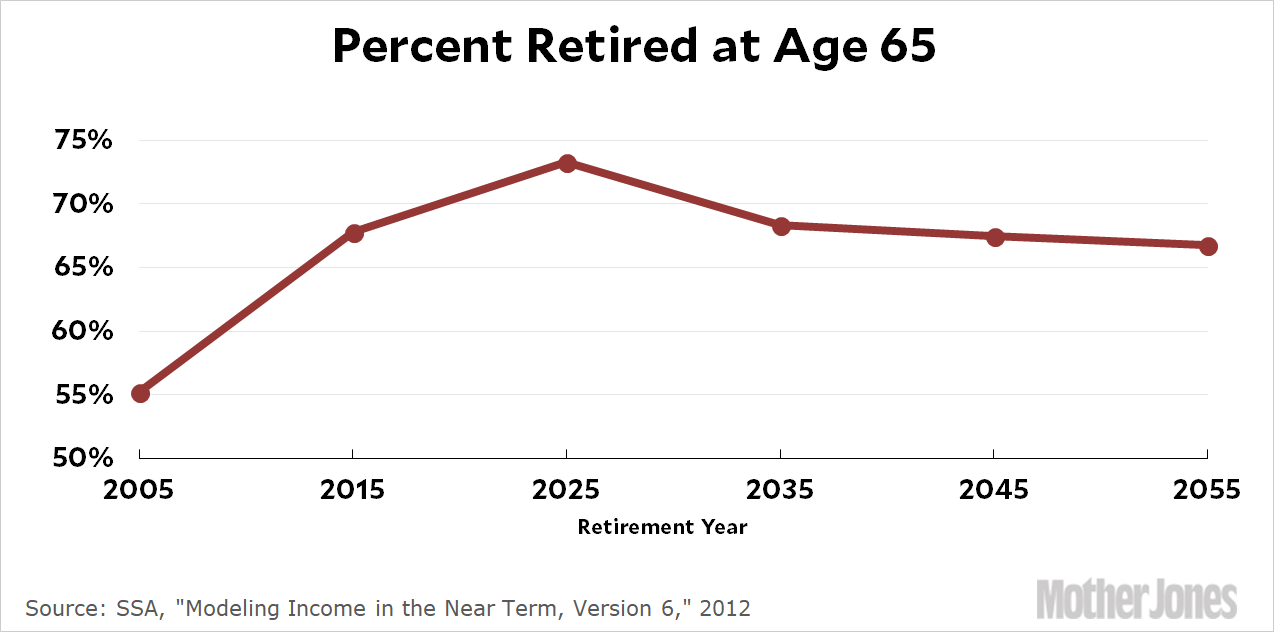
That looks good for boomers. Next up is the share of seniors drawing disability benefits:
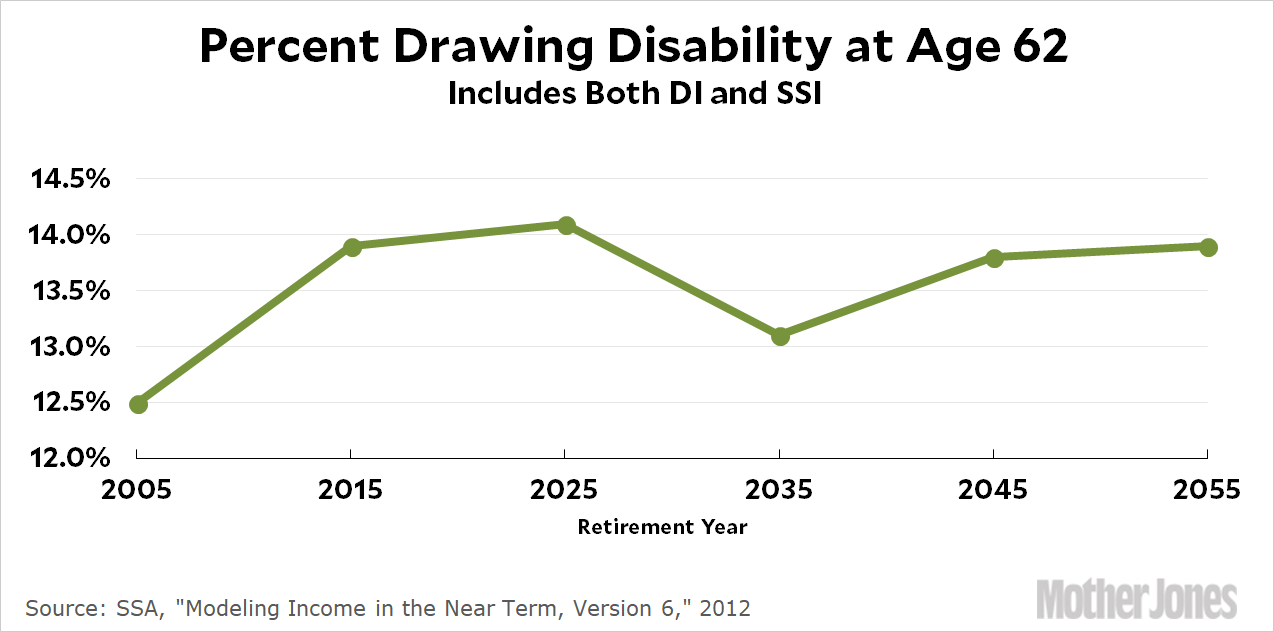
Boomers certainly seem to be getting their share of disability. Next up is the number of seniors covered by private pension plans:
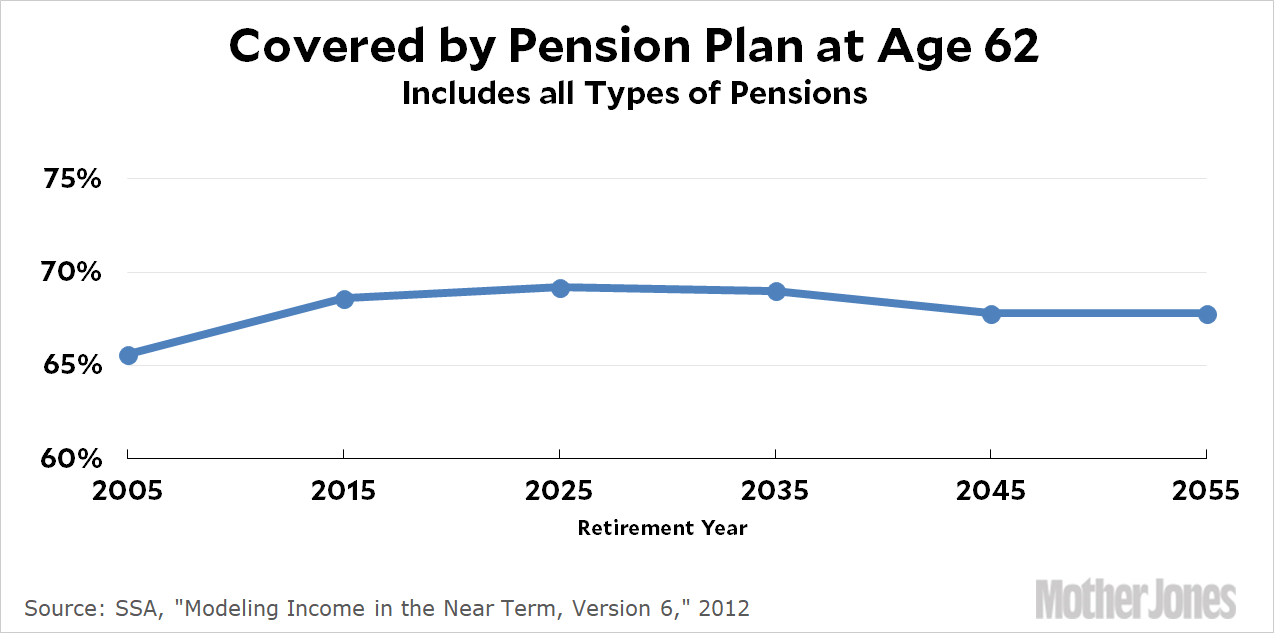
That looks fine too, but of course a pension only matters if it provides a fair amount of money. For some reason, MINT doesn’t model all pension income—probably because we simply don’t have data for old-style defined-benefit pensions—but they do model total financial wealth:
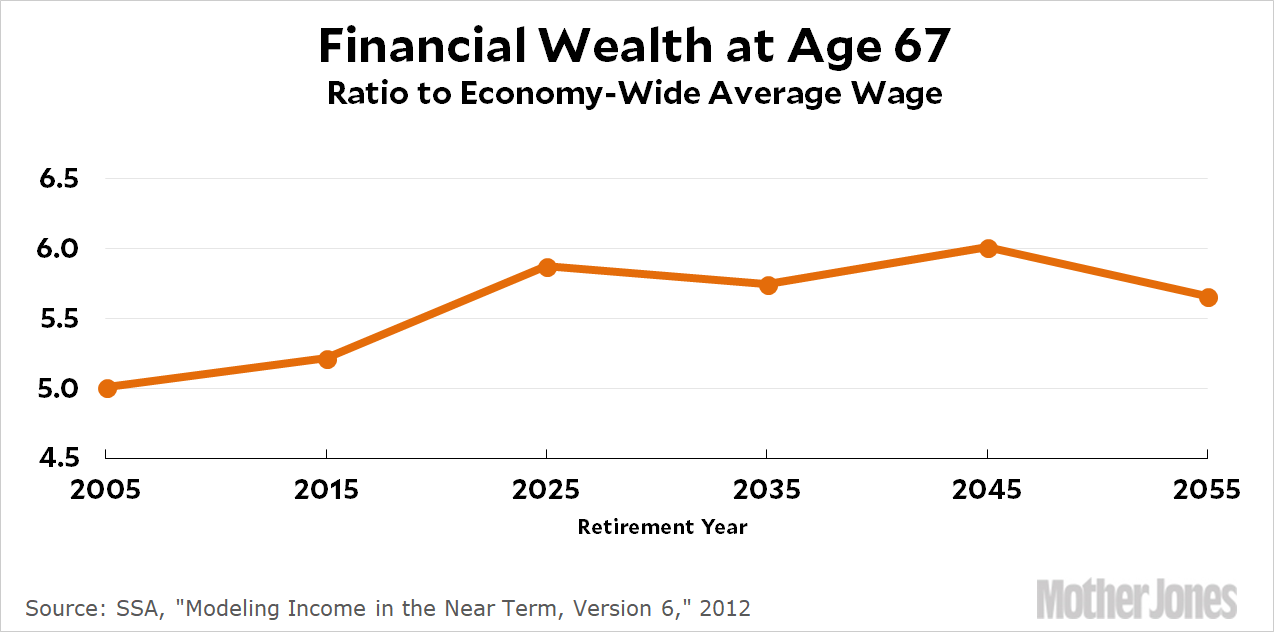
Now, this is an odd chart because it doesn’t include defined-benefit pension plans. However, the decline in DB plans is modest on a per-decade basis, and anyway, we already know from Alicia Munnell herself that total pension wealth has stayed pretty steady over the past 30 years even as defined contribution plans (IRAs, 401(k)s, etc) have supplanted DB plans. So this wealth chart is probably on pretty firm ground. Next up is income:
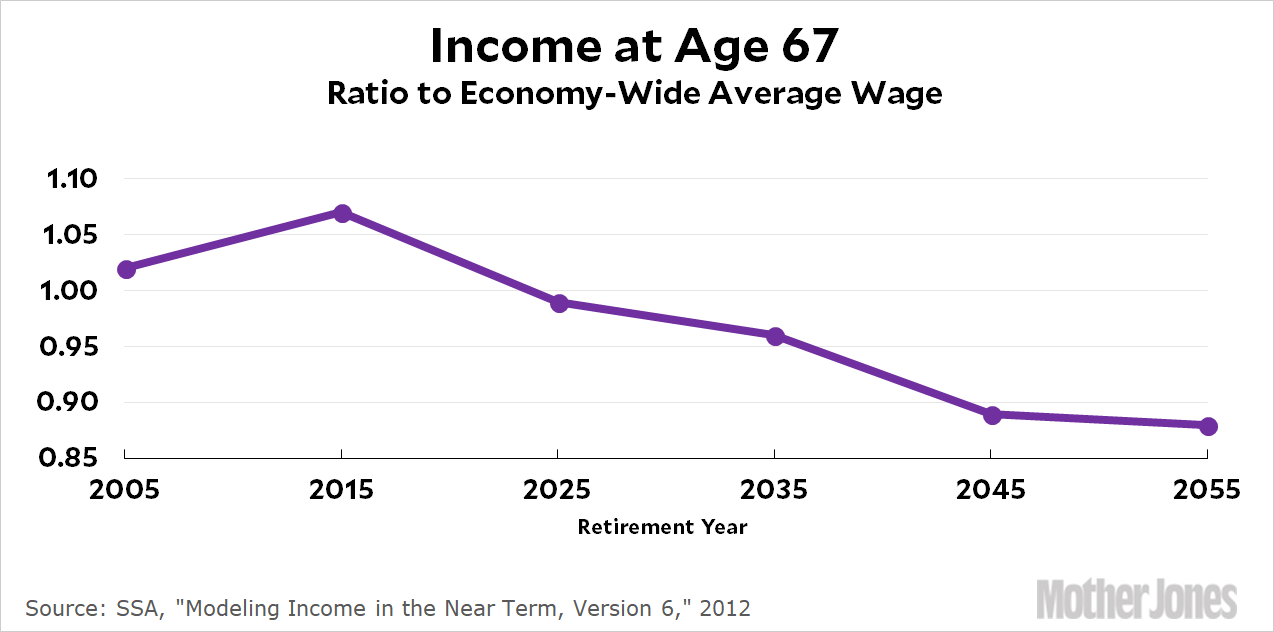
The news here for future generations isn’t great, but the current crop of boomers is doing pretty well. Their average retirement income is higher than the average income for working-age folks.
Overall, these figures simply don’t paint a grim picture. Boomers on average are doing fine in retirement. That doesn’t mean they’re all doing great, but there’s never been an era when all retirees were doing great.
I’m happy to panic over stuff that deserves panic, but boomer retirement isn’t one of them. The poor, who rely solely on Social Security, ought to get more generous benefits, and everyone ought to be covered for long-term nursing care. But those are specific problems that have been around forever. There’s nothing special about them that affects boomers more than other generations.


