Earlier this morning I mentioned that June’s rise in the unemployment rate was due to a big increase in the civilian labor force, mostly caused by people graduating from high school or college. If you’d like to see this in chart form, here it is:
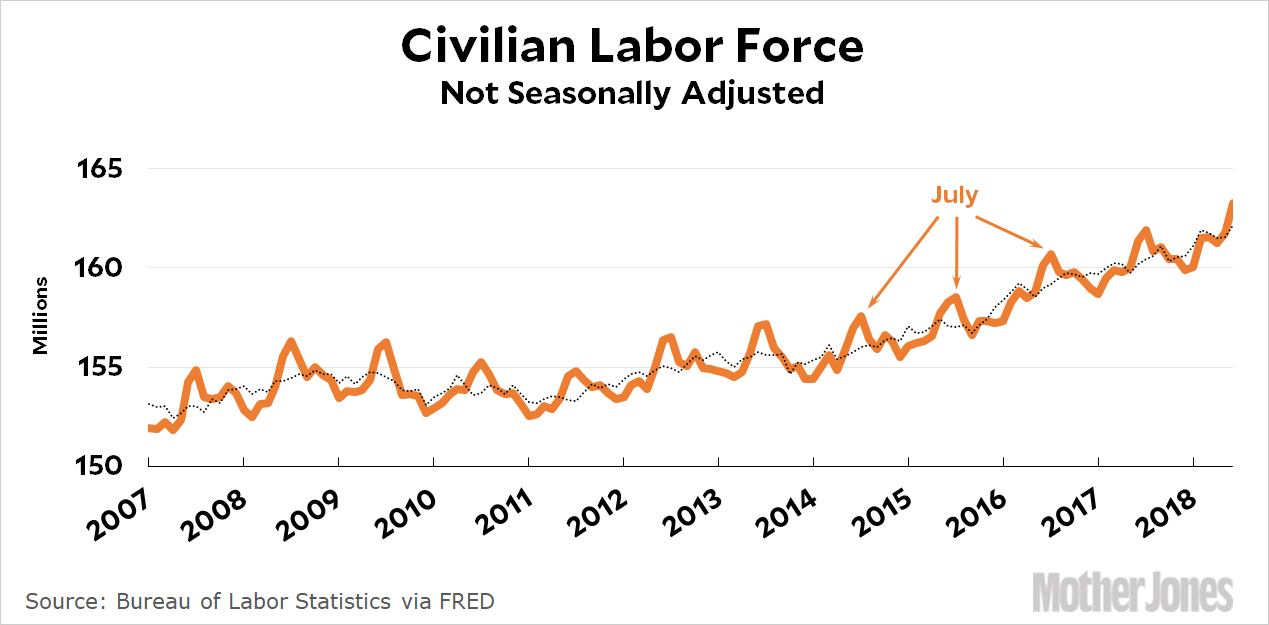
Every year, starting in June and peaking in July, the labor force spikes upward. Then September rolls around, and lots of kids go back to college, thus taking themselves out of the labor force. This is basically meaningless, which is why for most purposes we always use the seasonally adjusted figures, shown by the dotted line. That helps, but some of the spike remains, as it did in June’s numbers this year. Here’s how this affects the unemployment rate:
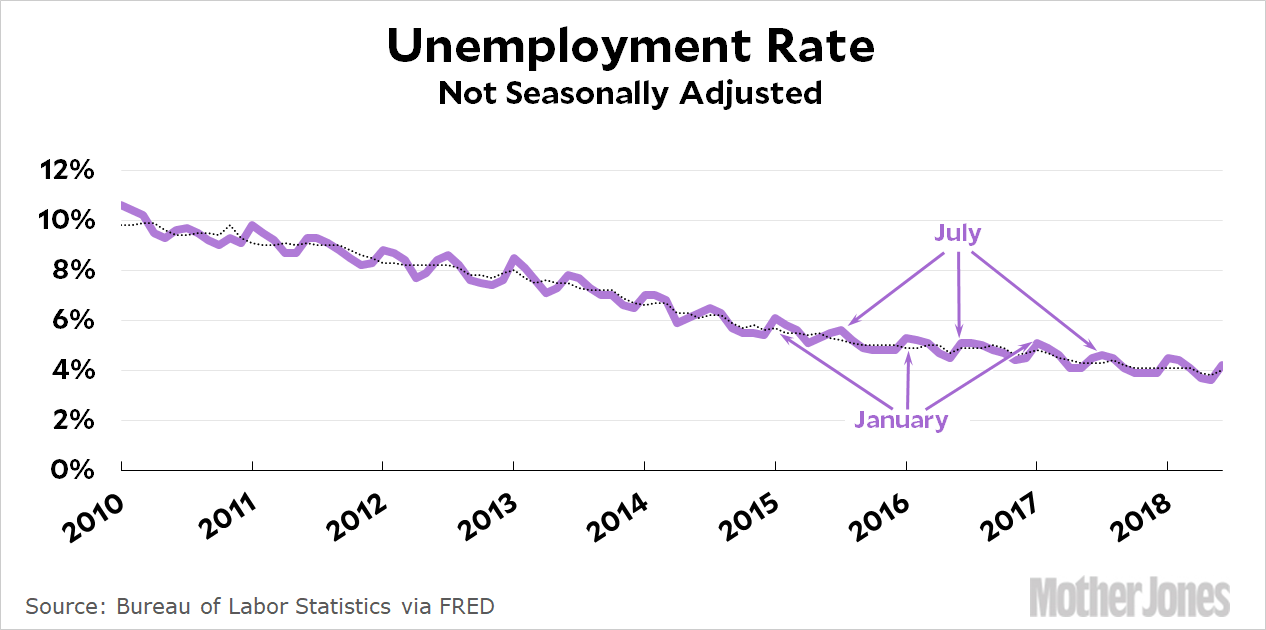
Unemployment spikes in January, when temporary holiday workers go back home, and in July, when kids are temporarily on summer vacation. The seasonal adjustment smooths out most of this, but not all. That’s one reason among many not to get too agitated over a single month’s numbers, especially in summer.
NOTE: Like most people, I always use seasonally adjusted figures. If you see a chart, it’s seasonally adjusted unless I specifically say otherwise.


