Earlier today I posted a chart showing average household income in the US vs. other developed countries. Several people understandably wanted to see this chart with median incomes instead of means, since high income inequality can artificially increase means even if middle-class families are struggling.
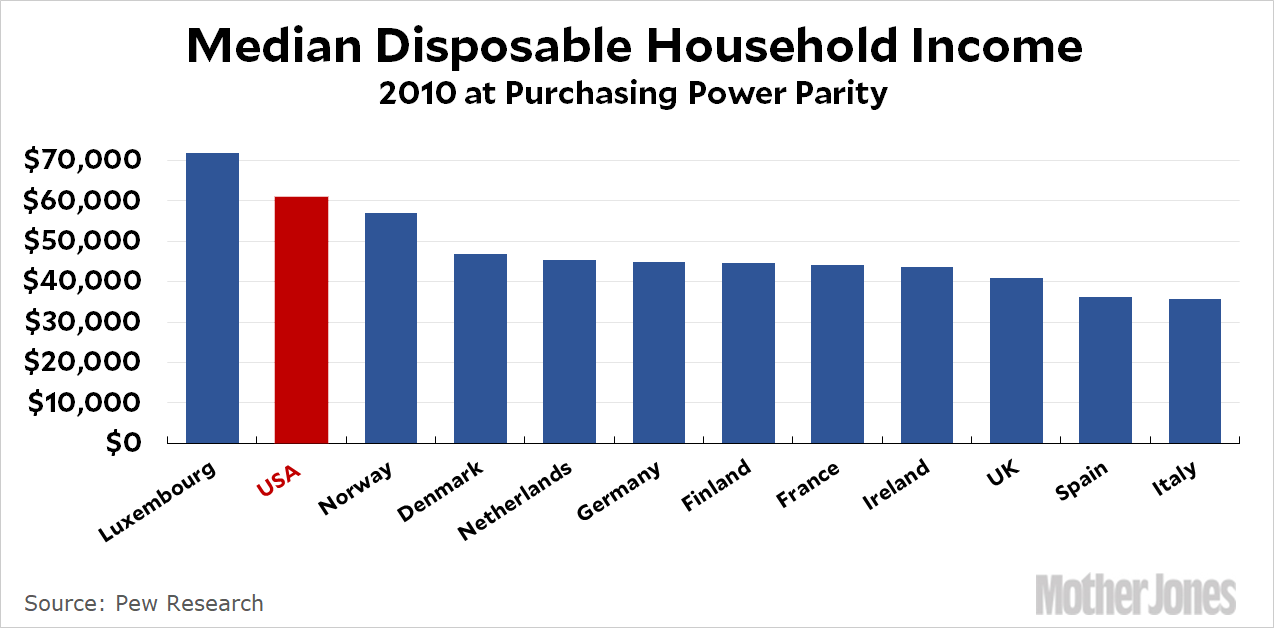
Unfortunately, a reliable measure of median incomes that’s consistent between countries is hard to come by. Here are a couple that I could find. The first one is from Pew Research:

According to Pew, median household income in America is 34 percent higher than the Netherlands; 36 percent higher than Germany; 38 percent higher than France; 49 percent higher than the UK; and 71 percent higher than Italy.
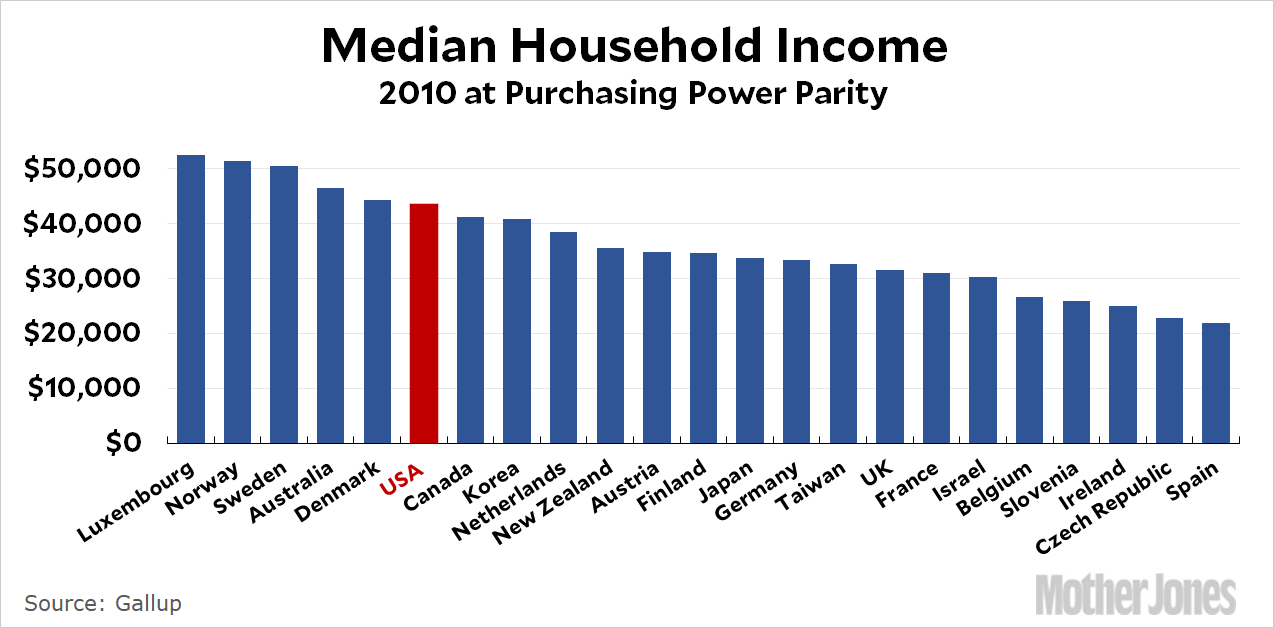
However, this is disposable income, which means income after taxes. This makes other countries look poorer since they have higher tax rates, but the flip side—that households get plenty of services in return for all those taxes—doesn’t get counted. This makes it a difficult metric to use. Here’s another one, based on survey data from Gallup:

According to Gallup, median household income in America is 13 percent higher than the Netherlands; 31 percent higher than Germany; 38 percent higher than the UK; and 40 percent higher than France.
However, this survey pegs the median household income in the US at $43,000 in 2010, which is far lower than Census Bureau figure (about $50,000). So how accurate is it? It’s hard to say.
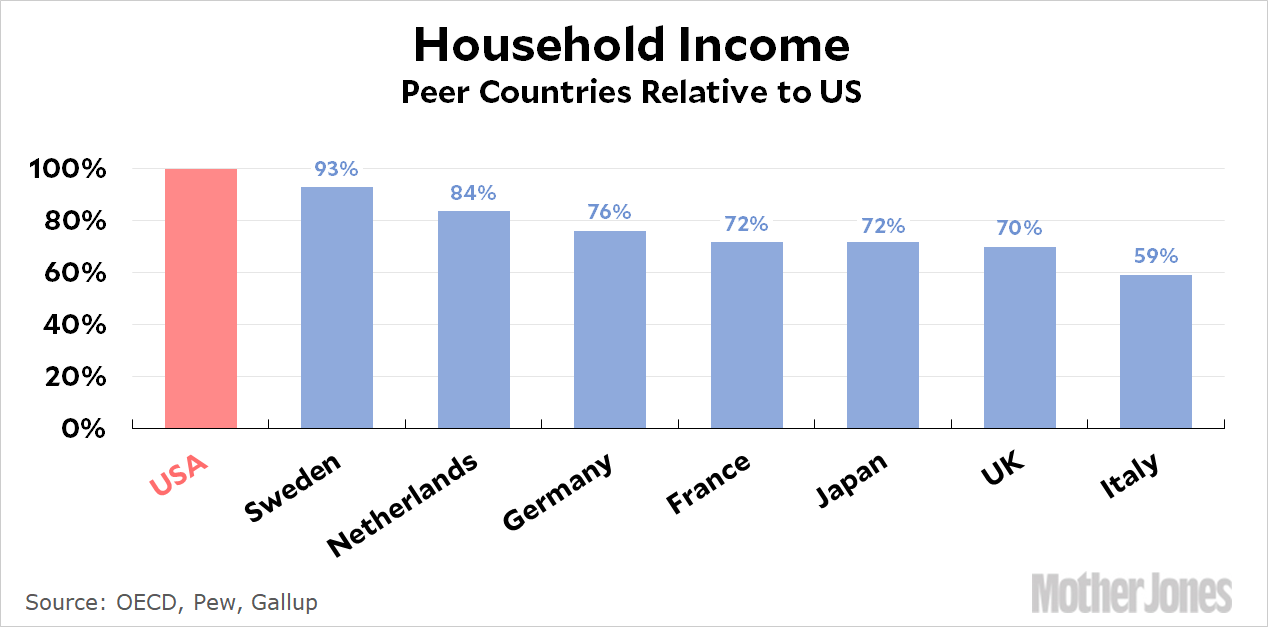
So it’s tricky. At the same time, even if the absolute numbers vary quite a bit, there’s fairly broad agreement about how countries compare to each other. If you average the three different measures (OECD, Gallup, and Pew), middle-class household income in the US is higher than every other comparable country:


