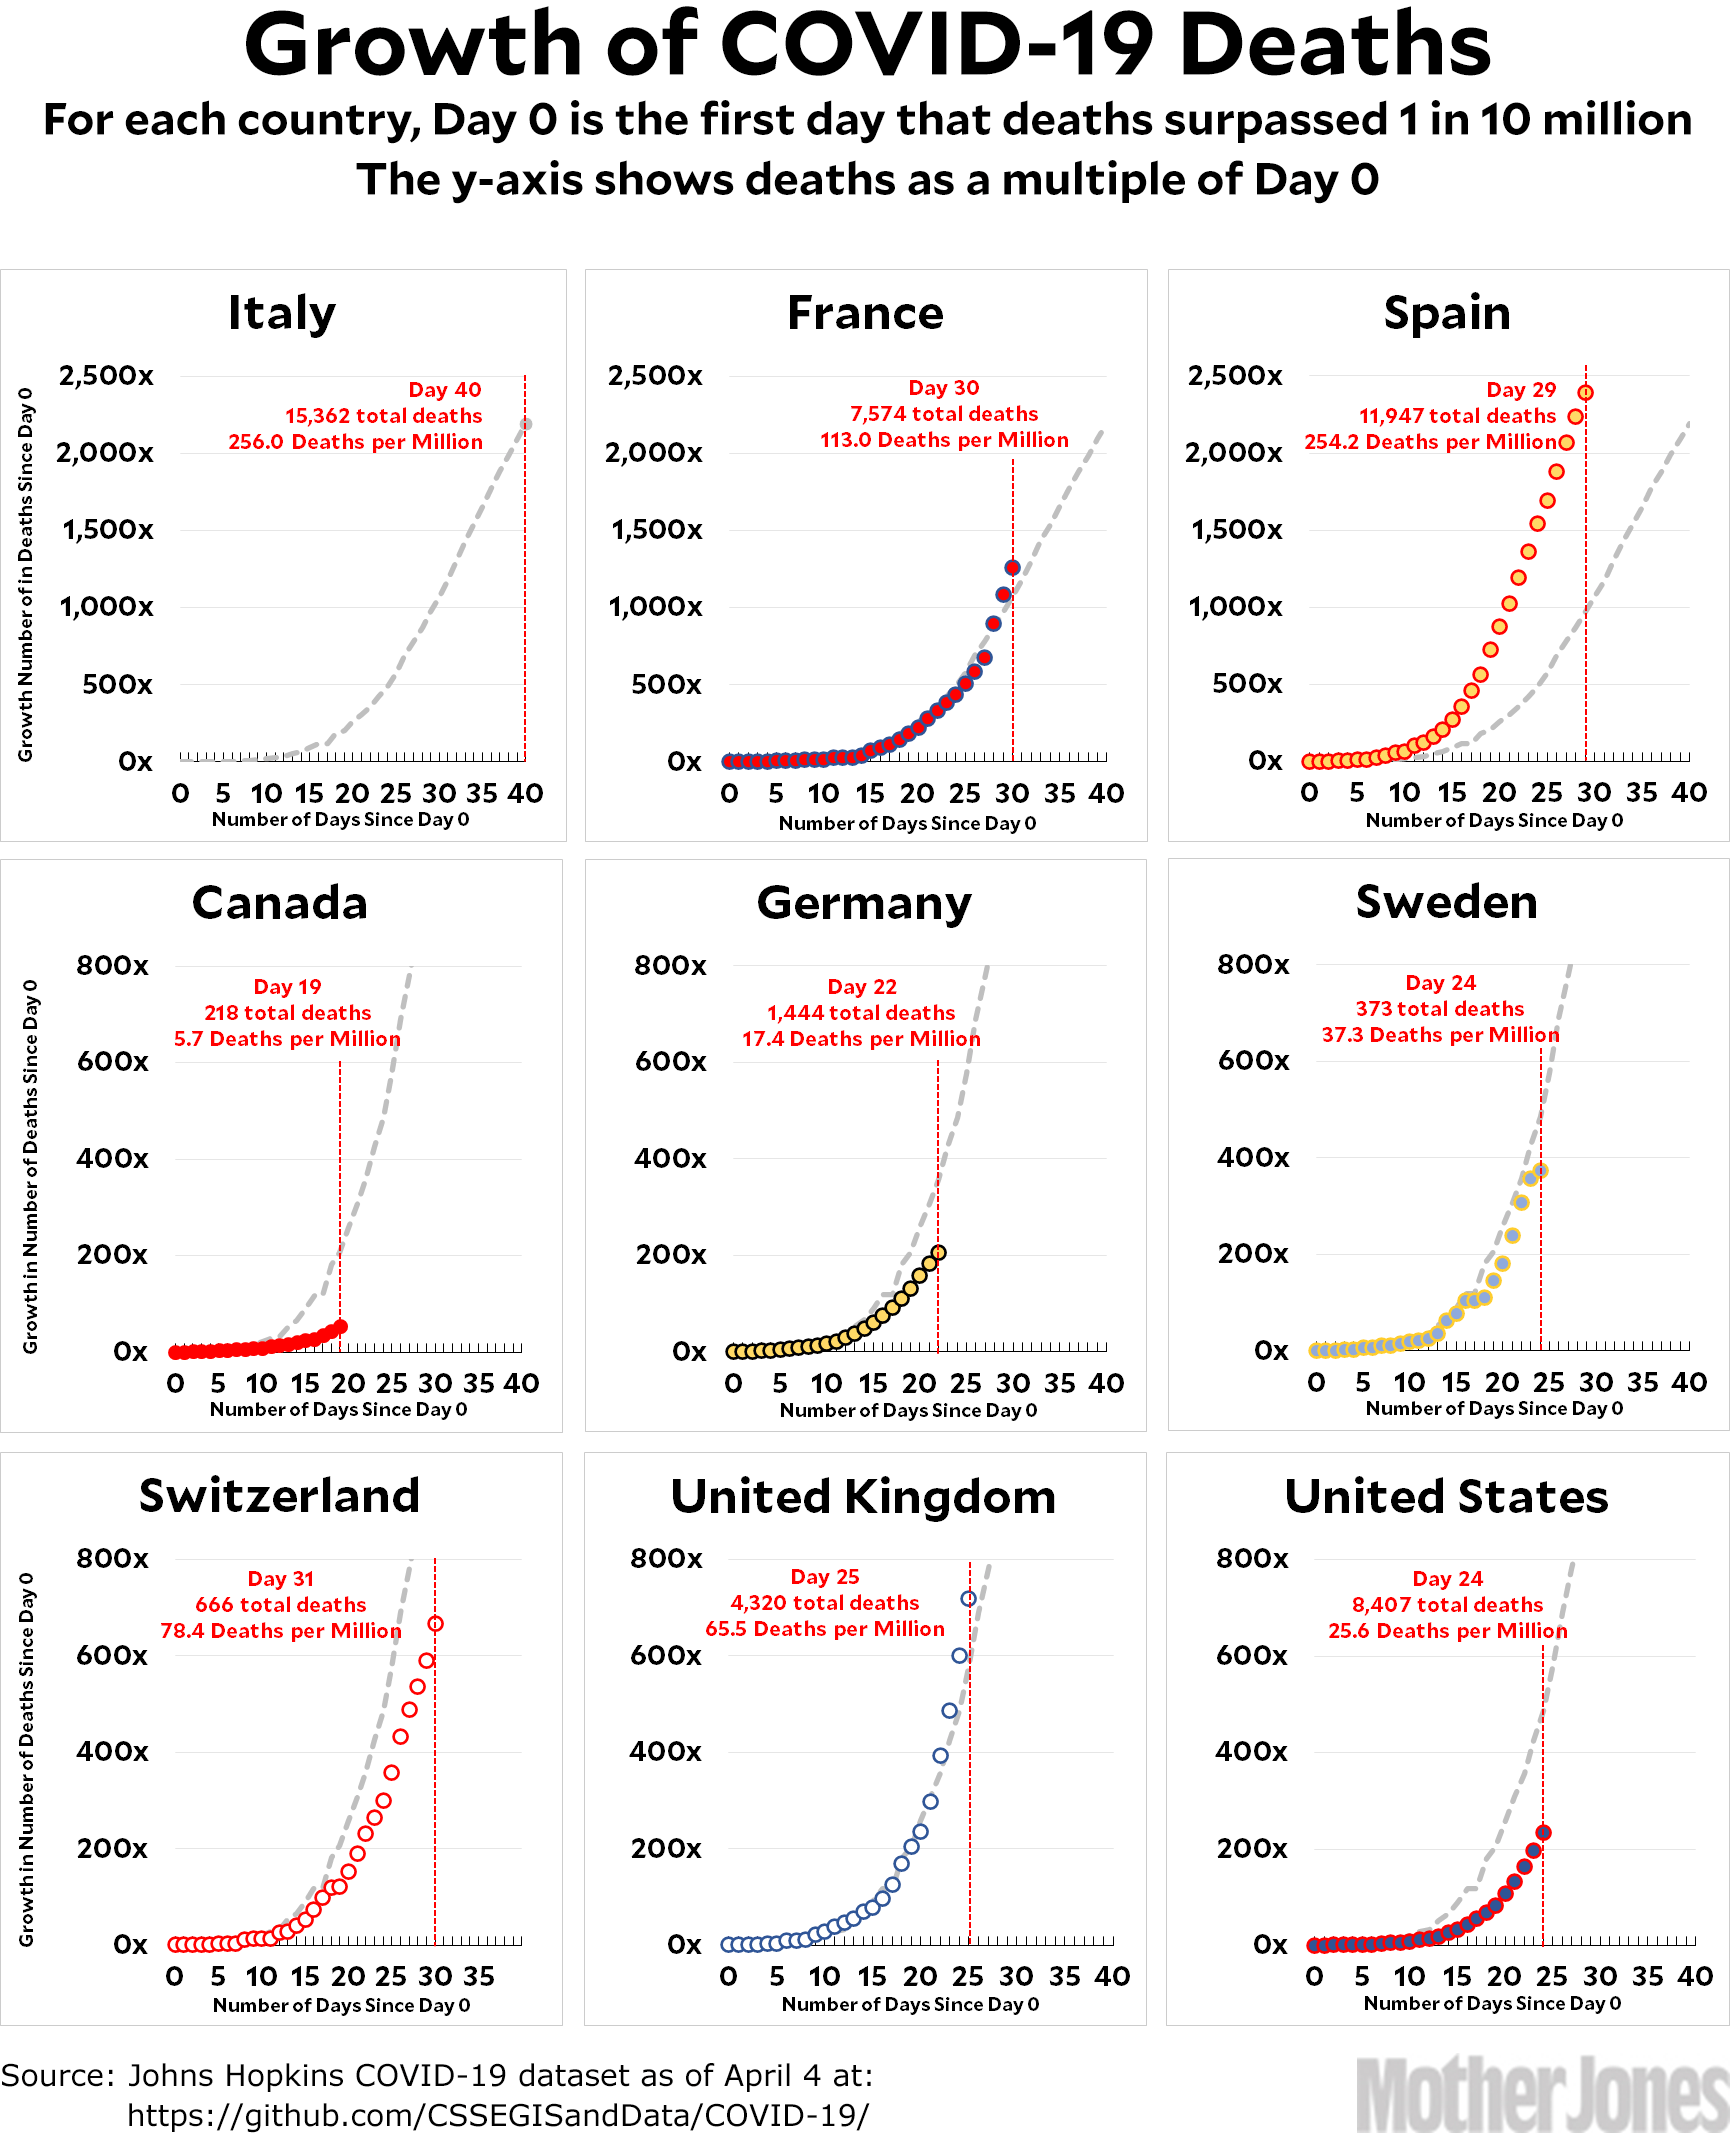
Here’s the coronavirus growth rate through April 4. Canada is now on Day 20 and it looks like they really have flattened their curve significantly. The Swedish data, as usual, should be taken with a grain of salt since this is a weekend.
How to read the charts: Let’s use France as an example. For them, Day 0 was March 5, when they surpassed one death per 10 million by recording their sixth death. They are currently at Day 30; total deaths are at 1,262x their initial level; and they have recorded a total of 113.0 deaths per million so far. As the chart shows, this is above where Italy was on their Day 30.
The raw data from Johns Hopkins is here.


