In an effort to see which Democratic candidate exceeded expectations on Super Tuesday, I grabbed the most recent polling numbers from pollster.com and actual vote totals from the New York Times. The result is this chart, which shows that the percentage of the vote that Obama actually received exceeded the percentage of the vote polling said he would receive in every state except Illinois (where expectations for BHO were in the stratosphere). In some instances, Obama shattered expectations: he did 11.8 percent better that polling suggested in Alabama, 8.5 percent better in Connecticut, 15 percent better in Georgia, and 12 percent better in Oklahoma.
But Clinton did better as well, which means that some portion of both candidates’ gains can be attributed to voters who told pollsters there were undecided but chose a candidate on election day. Clinton picked up slightly fewer of these voters, and in three states, underperformed by a moderate amount.
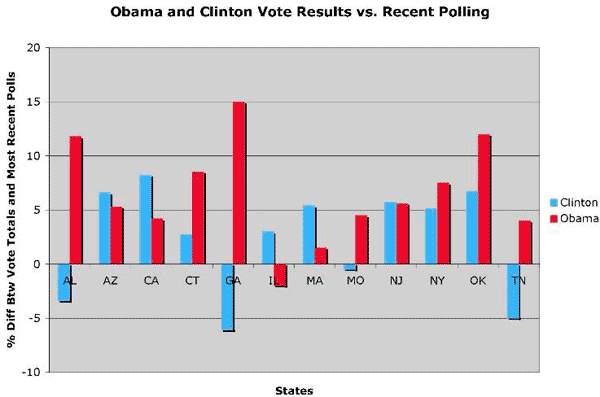
On average, Obama beat the polls by 6.5 percent and Clinton beat them by 2.4 percent. States that had insufficient polling were not included on this chart. Those states include one that went for Clinton (Arkansas), four that went for Obama (Colorado, Delaware, Idaho, and Kansas), and one that is still undecided (New Mexico).
