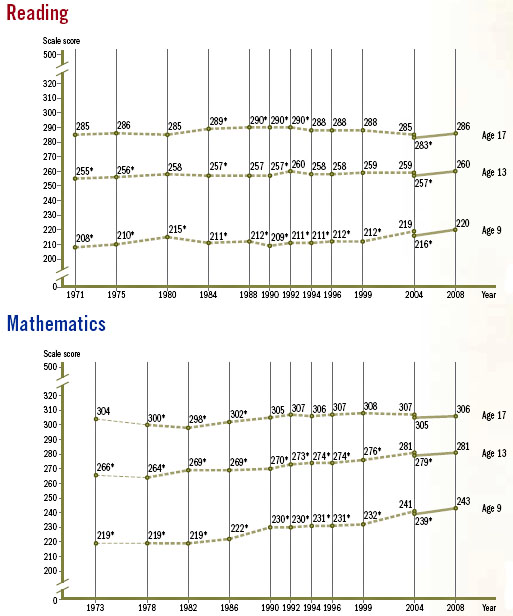
- ‹ previous
- 1195 of 2798
- next ›
Chart of the Day - 4.28.2009
Today's chart come from the long-term trends section of the NAEP, the "nation's report card." It shows — surprise! — long-term trends on the NAEP's reading and math tests, and the results are shockingly humdrum. (Can something be shockingly humdrum? I say yes!)
Did American education go completely to hell in the 70s and 80s? It sure doesn't look like it. Both reading and math scores stayed almost rock steady during the entire "Nation at Risk" period. Did things improve with the passage of NCLB and the advent of massive high-stakes testing? Scores for 9-year-olds have gone up a bit, but past evidence suggests that gains among young children usually wash out by the time they're 17. There might be a bit of progress over the past eight years, but the evidence is very thin and very tentative. Overall, among 17-year-olds, the average reading score during the past four decades has gone from 285 to 286 and the average math score has gone from 304 to 306. There's hardly cause for either alarm or excitement.
Obviously there are lots of details when you look at this stuff. NCLB mostly focuses on lower grades, and most of those kids haven't yet gone on to high school. So maybe it just needs more time. There are racial and gender gaps to look at, differences between public and private schools, and the effects of concentrated poverty. Still, I think it's useful sometimes to take a look at the bottom line: plain old average scores over the past four decades among 17-year-olds. And despite all the changes during that period in demography, testing, pedagogy, and popular culture, there just hasn't been much change. I'll leave it as an exercise for the reader whether that's good news or bad.


Correct me if I'm wrong, but
Correct me if I'm wrong, but doesn't average class size negatively correlate with performance? I wonder what would happen if all of the money going to support testing apparatus were ploughed into reducing class size. ...I guess we wouldn't know!
It Would Reduce Class Size 5%
I believe we spend about $10 billion on testing due to NCLB. If you divide that by $40,000 per teacher, you get about 250,000 additional teachers that could be hired. There are about 3,000,000 teachers now, so that would be a 5-10% increase, meaning that class size would go down 5-10%. Some of that money would also have to be invested in building and expanding schools, so 5% is a much better estimate than 10%. A class with 20 students would become a class with 19 students.
High School
This confirms my belief (always nice) that high schools the worst part of the American education system. But I'm not sure what to do about the problem. The school-within-a-school concept seems promising, but data is scarce on outcomes.
Take care with scale, there
tagged as:- result
To take the clearest example, notice Math for Age 9. Up to 243 from 219 in 1973. I realize the numbers are close to each other, but this is actually a large improvement.
http://nces.ed.gov/nationsreportcard/ltt/math-descriptions.asp
It's half the difference between adding two-digit numbers (200) and multiplying one and two-digit numbers (250)
Lordy. I didn't get one-digit multiplication until fifth grade, and I have a master's in math.
Put another way, Age 9 and Age 13 students today appear to be in math somewhere around the place Age 11 and 15 students were in twenty years ago. If that's true... well one year of reading and two of math is NOT humdrum!
manufactured crisis!
Kevin:
I use these SAME graphs in my teaching of the next generation of teachers.
This is precisely the point that educational research David Berliner and David Biddle make in their seminal book "The manufactured crisis: myths, fraud, and the attack on America's public schools" (1995). They argue that the educational "crisis"--which begat the standards movement, which begat the accountability movement--was manufactured by fundementalists/conservatives to scapegoat American public schools for a whole host of perceived societal ills. The authors clearly demonstrate that where schools DO fail, they fail because of larger systemic issues related to poverty, access to livable wages, access to health care, and equitable school funding--all issues politicians from both parties are loathe to deal with directly. They don't fail because of lazy, incompetent teachers and students.
Don't they re-normalize
Don't they re-normalize these tests?
That is, when they're developing the tests, don't they change the questions, with the goal of generating a certain average score? Some questions are dropped because they're "too hard," others are "too easy..."
Just want to make sure we're not actually seeing a graph of how good American test-designers are at hitting their targets.
Do they give the same or
Do they give the same or equivalent reading and math tests every year, or are they easier every year? From diddling around on political forums, I find you can tell the age of a poster by how poor his grammar is. I recall one poster whose grammar was so bad, I asked him if he were a native English speaker. He tried to BS that he was an American of my age, but of course no one of my age ever started sentences with small letters, so a few of us had a good laugh at his expense, and he eventually 'fessed up to being of the ungrammatical generation.
How may people need math beyond pushing keys on a calculator? I don't think I could do long division any more. The jobs of the future are pushing keys with little icons on them at McDonald's and pushing items past a scanner.
Average I wouldn't expect to change...
...But the median and range of the scores seems more interesting, to me. Then we know what the curve was.
In my highschool, the bell curve was almost always inverted. Things were such that it was actually quite difficult to try to succeed and not make it. You either made it, or you failed horribly. There really wasn't an in-between. And none of the course designs the teachers could find really made it better - none of them seemed actually designed to help people get from one group to the other.
I think it's great that nine year olds know more math and reading than they used to; I'm more impressed by that than any great high school scores. It shows that we can teach people who want to learn, and kids want to learn. Teens... Well...
I am still stuck on why we
I am still stuck on why we cram high school kids into classrooms. My understanding, correct me, is that classrooms are no longer cost effective when combining technology and individual study with regular one on one meetings with the teacher.
Awfully superficial for you,
Awfully superficial for you, Kevin. What the hell do those numbers mean? You must make at least a passing attempt to calibrate this information.
Math hugely important.
Luther, math is probably the single most important thing we humans have devised for understanding the world. It is hugely important for evaluation of all sorts of decisions. Am I better off doing A or B? That is often a question requiring some basic math ability. Particularly in discussions of public policy, lots of people run off on tangents that just aren't relevant, usually because a million, billion, or trillion are all the same to them, and they fall back on an emotional basis for judging whether the good in column A outweighs the harm in column B.
Luther the cranky old neighbor.
Yup Luther, in the good old days all the students were so much better.
Not.
Sheesh, I bet my cousin is about your age, and he never learned to read and write. My gramma used to slam us kids because we no longer learned to use the Palmer method when learning cursive writing.
And I slammed my kids with their graphing calculators who didn't know how to use the tables in the CRC to generate logorithms.
IIRC my HS sent about 30% of graduating Seniors on to college, and the local HS here is sending about 80%.
But, yeah, if you want to think everyone over 40 knows proper grammar, well, go right ahead.
Tripp
Disaggregate!
It doesn't really make sense to look at these data except by breaking them up into the large constituent groups--white, black, Hispanic.
For the most part, all three groups show substantial gains over the years since the NAEP began. The overall averages stay largely the same because the highest-scoring group (the whites) now make up a much smaller percentage of the total than they did when NAEP began in 1971. White kids were roughly 80 percent of the total tested population then; now it's in the mid-50s.
All three groups are doing better (and the gaps are getting smaller). That reality is disguised by looking at the total.