Over the weekend I posted an estimate from Kevin Systrom of how well states are doing in fighting COVID-19. I warned that I couldn’t judge its value independently, and sure enough, one of Tyler Cowen’s correspondents says it’s no good:
Estimating R from noisy real-world data when you don’t know the underlying model is fundamentally difficult….
There’s more at the link, and I have nothing special to say about this particular critique. However, I do have a couple of more general comments.
First, the Systrom estimate is based on case counts, and there’s no question that the reliability of case counts is very poor. Systrom compared case counts only within a 7-day period, and if you assume that the errors don’t change much over such a short period, then perhaps his resulting estimate isn’t too terrible. That said, no matter what statistical wizardry you apply to case counts, you’ll never escape the underlying crappiness of the data.
Second, don’t obsess over the fact that Systrom is estimating R. The underlying data is case counts, and you can do anything you want to them. If you want something that looks sort of R-like, you can do it by applying the appropriate transformations. If you want something that looks different, you can do that too. You’re better off thinking of Systrom’s results not as, literally, R, but as a derivation of “something related to the spread of coronavirus.” But remember that no matter what the derivation is, it’s just a different way of looking at case counts.
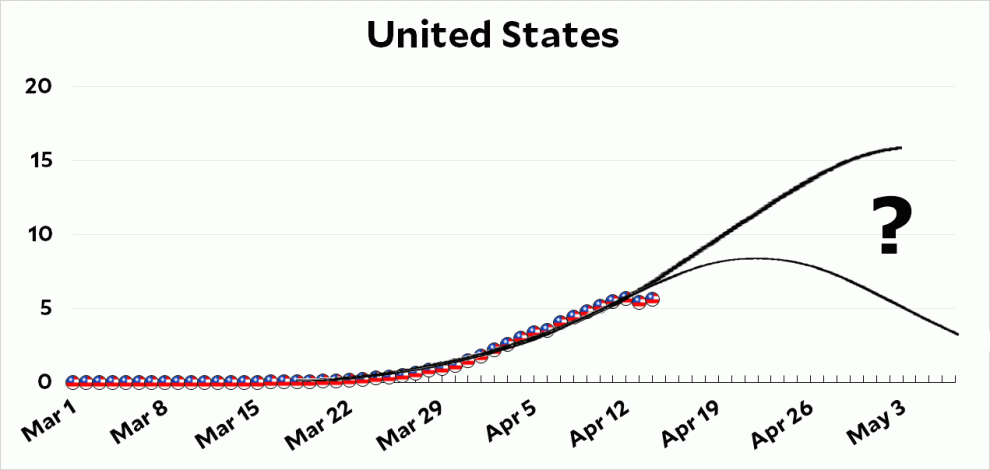
Third, I’m skeptical of the demand for an “underlying model” before you do anything else. You may have noticed that there are lots of models of the spread of COVID-19 and they’re all over the map. One of the reasons for this is simple: if you create a model de novo and then fit it to the data, you can get practically any result you want. Obviously experts have some insight into which models are better than others, but this is still a new virus with a lot of unknowns. And very small changes in model specifications can lead to surprisingly large changes in projections. Right now, an awful lot of the model inputs are assumptions with very little empirical backup because COVID-19 is so new, so you should take nearly any model projection with a big grain of salt.
This is where I am right now. Maybe I’m wrong and the models are better than I think. But watching the modelers apply massive amounts of math to fundamentally unreliable data has made me skeptical. This is why, for example, the only thing I show in my charts is daily deaths on a 6-day rolling average. You need to smooth the daily data in some way, but I don’t want to pretend like I’m showing you anything much more than just the basic numbers. And the mortality numbers, although far from perfect, are a whole lot better than case counts.


