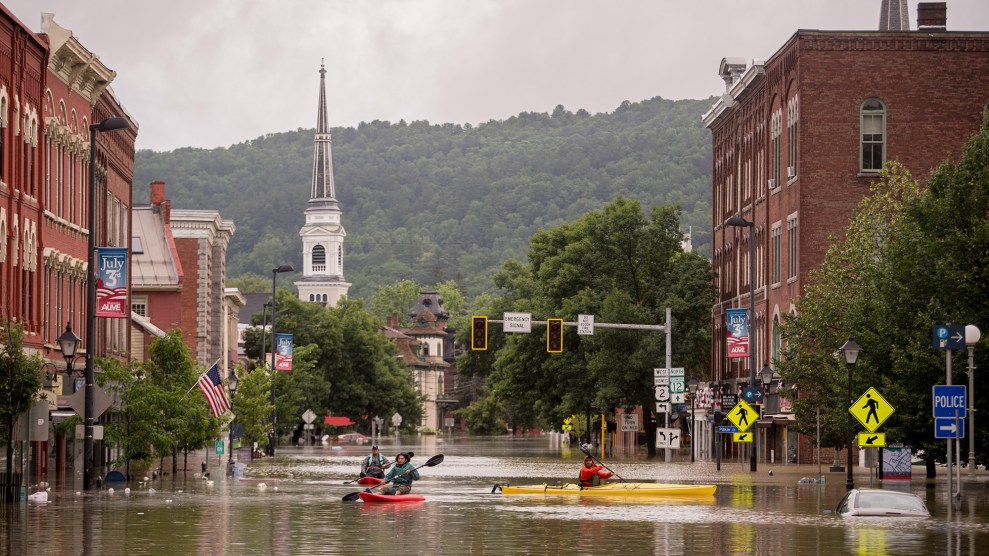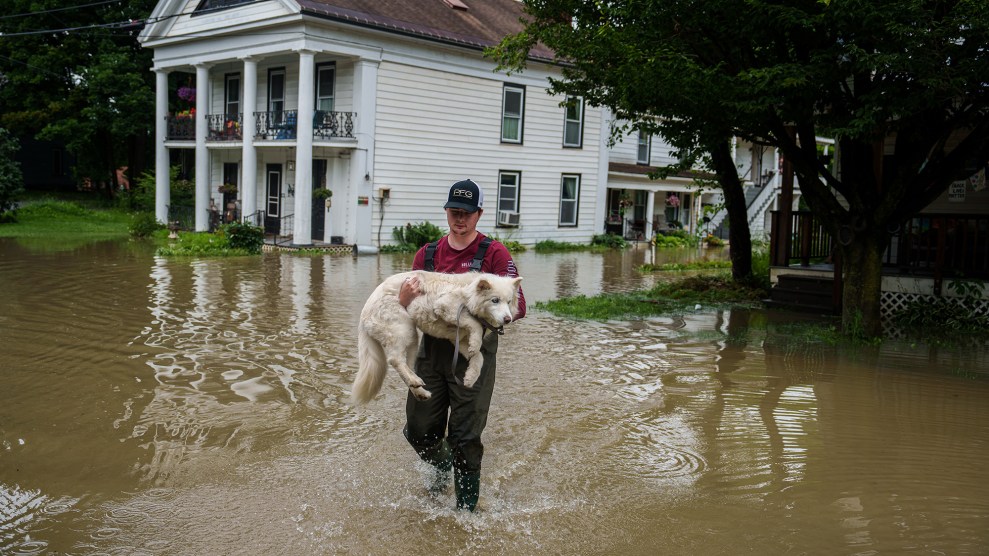
Tyler Jovic, of Montpelier, carries his neighbor's dog to dry ground on July 11, 2023. John Tully/The Washington Post/Getty
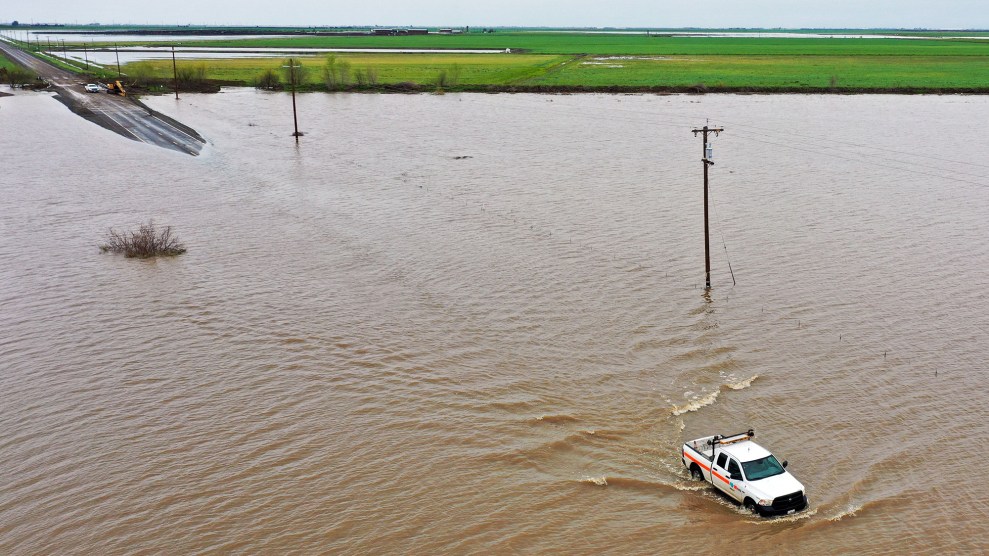
This year’s floods have been historically intense. The storms that hit Vermont on July 10—delivering more than five inches of rain in a single day and forcing hundreds to evacuate their homes—had a 1 percent chance of occurring annually, leading to a “1-in-100 year” flood. Governor Kathy Hochul called storms that drenched Orange County that same day a “1-in-1,000-year weather event.” Similarly, in April, when Fort Lauderdale experienced more than two feet of rain in a 24-hour period, meteorologists said the disaster was a “1-in-1,000-year event.”
But thanks to climate change, what was once considered a “100-year” or “1,000-year” rainfall may be wildly outdated, according to a new, peer-reviewed report from climate research nonprofit First Street Foundation. To characterize the severity of these events, officials typically rely on Atlas 14, a tool developed by the National Oceanic and Atmospheric Administration and widely considered the gold standard for atmospheric statistics. The problem is, most of the data plugged into Atlas 14 hasn’t been adjusted for climate change, says Jeremy Porter, First Street Foundation’s head of climate implications, meaning it has failed to capture things like the rise in global temperature and humidity, which can cause more severe storms. (NOAA has said it plans to update Atlas 14, but Atlas 15 reportedly won’t be available until 2027.)
When First Street’s researchers did adjust for today’s hotter, wetter, atmosphere, they found that deluges like those seen across the Northeast this summer are happening much more often than once every 100 years. In the most severe cases, what was once considered a “100-year flood” in some parts of the country is happening every eight years. Case in point: Officials in Vermont have characterized the state’s floods as on par with those during Hurricane Irene in 2011. “We just haven’t been taking into account climate change over the last 40 years or so,” Porter says. As a result, he argues, “there’s just a big gap in our understanding of risk.”
To learn more about the significance of this change—both for science and language itself—I chatted with Porter this week over Zoom. You can read an edited and condensed version of our discussion below.
The terms “100-year-flood” or “1,000-year-flood” are based on historic data. Where does it come from? Are we talking about a specific range of years?
Clearly, nobody has 1,000 years of flood data, right? Calculating 1,000-year flood risk requires some extrapolation with some type of model. So you can collect data for about 20 to 30 years. From that, you can usually make pretty good estimations of what you expect the 100-year flood or the 1,000-year flood to look like.
Generally, to get it corrected for today’s climate, you have to also bring in what are called “global climate models.” NASA has had some of these. These models give you the ability to understand, what’s precipitation going to look like in 10 years and 20 years and 30 years? What’s humidity going to look like over that time period? What about drought? Or temperature? And those all end up being inputs into the model, which allow you to understand how precipitation and rainfall and flooding are going to change in the future.
“One-hundred-year flood” is the terminology we use, but what it really means is that there’s a 1 percent chance of having a certain amount of water in a given year. A 1,000-year flood is a 0.1 percent chance. You may hit it this year. Next year, you may hit it again. It just resets year after year. That’s one of the problems with having “100-year” terminology: People have a 100-year flood and they assume, “I don’t have to deal with a 100-year flood again for 99 years.” But it’s all based on probabilities.
This is a bit of a nerdy question. But are there other units for describing the severity of flooding that would be better?
Most of the time, the metric that you’ll see, if it’s not “100-year,” or “1000-year,” it’ll be a daily rainfall rate or an hourly rainfall rate. I live on Long Island, and we just had three inches per hour on Sunday. I got a little bit of water in my basement. I looked at the estimates, and it was a 100-year flood event based on NOAA Atlas 14 records. But the problem is, if you say, “There’s three inches per hour”—I study this stuff, and right away, I’m like, I don’t know if that’s super bad or not. Like, what does that mean? But if you say it’s a 100-year event, all of a sudden, people say, “Well, that seems pretty unlikely.”
So I think there is a need to be able to put it in a historic context. I personally think something like a probability or percent would be better, like, “There was a 1 percent chance we would get that [amount of] water this year.”
Your report shows that 100-year floods are happening more frequently, making them more like 20-year or 25-year floods. But in this new normal, what are actual 100-year floods going to look like?
Adjusting for climate change, 100-year floods are more severe. In Manhattan, for instance, based on NOAA Atlas 14, a 100-year flood would produce about three inches per hour of rainfall. But now if you just adjust for climate change, we’re actually seeing just over four-and-a-half inches per hour in a true 100-year flood.
In a way, it sounds like the goalposts are moving. Is there a risk that we’re making severe flooding sound less bad?
If you think about infrastructure, so many of our design standards, our sewers, and the climate adaptations that we’re creating to protect ourselves against flood risk rely on these estimates. So if our stormwater system, for instance, is built to a level that should protect us against a “100-year flood” [based on outdated estimates], it’s actually not doing that. That 100-year flood is actually occurring much more frequently. And when the real one-in-100-year flood does come, we’re not going to be able to handle the water.
That just made it click for me. By using outdated flood estimates, we might be shooting ourselves in the foot.
Yes. And the Infrastructure Improvement and Jobs Act granted $1.2 trillion for new infrastructure. It’s a once-in-a-generation chance to improve our infrastructure across the country. And a good deal of that may be built to standards that are going to be out of date as soon as they’re in the ground.
In New Jersey, for instance, they’re rebuilding a road because it has problems flooding. And they’re building it to the 10-year flood standard. But the 10-year flood standard in that area actually occurs every four years. In the future, it will be every two years. So now you’re going to have water on that road every two years. The water degrades the concrete and all of a sudden the usefulness of the road we’re spending millions of dollars to rebuild is not going to be able to last.
What are the areas of the country where “100-year flooding” is now much more common than we thought? Where have we been getting it really wrong?
The Midwest and the Northeast are the places where over the past few decades, we’ve seen an increase in flooding driven by extreme precipitation. In Philadelphia, a one-in-100-year event now occurs about once every 17 years. In New York, it’s about once every 20 years. In Vermont, it was about once every 40 years or so.
It also skews the way we think about these events. When Governor Hochul said, it was a one-in-1,000-year flood event that occurred just north of New York City a couple of weeks ago, we went back to our estimates—it actually occurs about every 120 years. So she’s saying it’s rare. But we’re actually at a much, much higher risk of that happening again.

