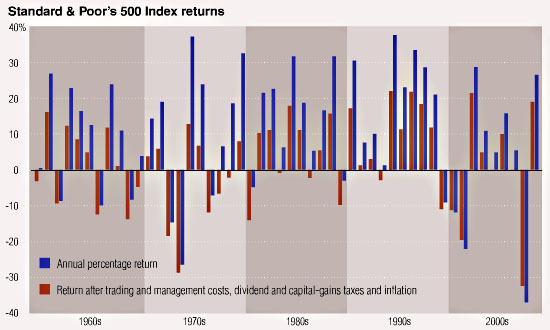
CJR’s Ryan Chittum points us to the chart below, which compares S&P 500 stock market returns over the past 50 years (blue bars) to those same returns after accounting for trading and management costs, dividend and capital-gains taxes, and inflation (red bars). It’s part of a Bloomberg piece by David Wilson summarizing a report prepared by David Bianco, chief U.S. equity strategist at Bank of America Merrill Lynch. Once you take into account all the adjustments, the annual average return of the S&P 500 goes from 9.5% to 1.3%. Chittum comments:
Just remember when those financial advisers tell you to expect 8 percent to 10 percent annual returns that in real money over the last 50 years, you took home a measly 1.3 percent. As I wrote in January: “You have to wonder if there’s a connection to be drawn between the low savings rate and the idea that took hold in the last three decades, which still hasn’t been extinguished even after this miserable decade, that investing in stocks means you’ll get big returns on your money.”
Of course, your basic money market account is returning about 0% these days, give or take a few mils, so it’s not as if we little guys have a ton of other great investment opportunities. Luckily, the Wall Street tycoon set is still doing well. It’s not all bad news out there, my friends.


