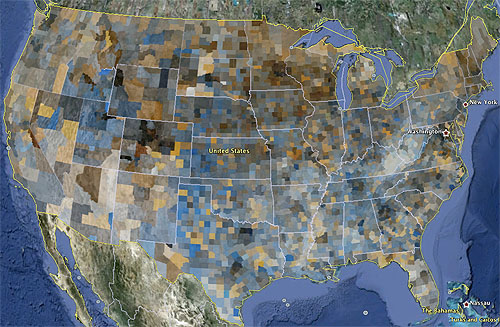
This comes from Stuart Staniford, and it’s an employment map of the United States by county. Dark areas have high employment and light areas have low employment. Bluish area have relatively high male employment and brownish areas have relatively high female employment.
What does it all mean? Beats me. Basically, it’s just data geekery. But kind of interesting anyway, no? Stuart has more speculation over at his place.


