How does a decline in consumer demand affect different geographic regions? Well, suppose that consumer demand falls heavily in Orange County, where I live. You’d naturally expect to see a large employment drop in industries that are stuck in Orange County and depend solely on Orange Country residents for their business. Local accounting firms, for example. Schools. Restaurants. Construction companies.
But what about industries that sell their stuff all over the country? Pharmaceuticals, say, or high tech or clothing. In Orange County, that would include companies like Allergan, Western Digital, Broadcom, and Quiksilver. You’d expect employment at these companies to react not so much to Orange County, but to the country as a whole. So even if Orange County is doing poorly, these companies might continue to do well as long as the country is doing well.
The first category is called the non-tradable sector. The second is called the tradable sector. So if weak consumer demand is at the core of our economic problems, here’s what you’d expect to see:
- Employment in the non-tradable sector would be worse in counties that are the most depressed.
- Employment in the tradable sector would be about the same everywhere, and would depend on how the country as a whole is doing.
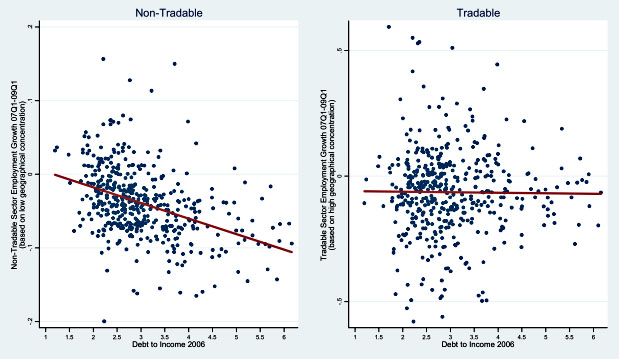
So is this how things look? Economists Atif Mian and Amir Sufi took a look at tradable and non-tradable employment in all large counties in the United States and plotted it against the level of debt in each county. If consumer demand is responsible for our sluggish economy, you’d expect counties with high debt loads to have employment declines in the non-tradable sectors, but to see no real differences in the tradable sector. And that’s exactly what they found:

From the paper:
In order to remove any direct effect of the residential housing boom and bust, we explicitly remove construction or any other real-estate related sector from the non-tradable definition.
Consistent with the aggregate demand channel, job losses in the non-tradable sector from 2007 to 2009 were significantly higher in high leverage counties that experienced sharp demand declines. In particular, a one standard deviation increase in the 2006 debt to income ratio of a county is associated with a 3 percentage point drop in non-tradable employment during this time period, which is 2/5 a standard deviation. Moreover, the large decline in employment in the tradable sector is completely uncorrelated with 2006 debt to income – exactly as predicted by the aggregate demand channel.
This comes via Paul Krugman, who says this paper demonstrates that the data doesn’t really fit a structural unemployment story, but instead fits a story in which spending is just too low. “The empirical evidence,” he says, “more and more, exhibits a clear Keynesian bias.”
For related work from Mian and Sufi on the effect of household debt on unemployment, see this post from earlier in the year.


