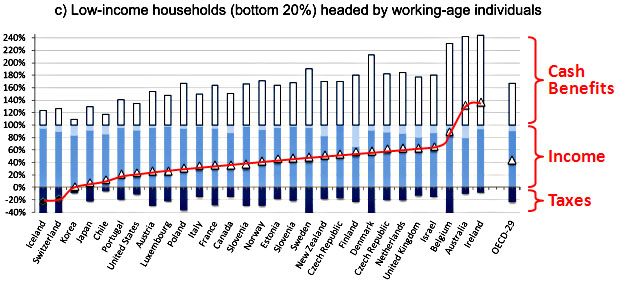
Via Reihan Salam, here’s an interesting, if limited bit of raw data. For each of the richest countries in the world it shows cash benefits (top white bar) and taxes (bottom dark blue bar) for the bottom 20% of the working-age population. Both are scaled to income. In the United States, for example, cash benefits on average amount to about 35% of market income, while taxes amount to about 11% of income. The red triangles show the net amount of cash transfer. In the United States, it averages about 24% of market income.
This doesn’t include non-cash benefits such as health insurance, so it doesn’t tell the whole story. But what the study does tell us is that over the past 30 years (a) income inequality has been rising nearly everywhere, while (b) cash benefits to the non-elderly have been declining almost everywhere. In the United States, those benefits amount to roughly 2% of GDP. That’s pretty stingy. The full study is here.


