
<a href="http://www.flickr.com/photos/o5com/5126344583/">o5com</a>/Flickr
Everybody knows that household debt in America has increased dramatically over the past few decades. But why? One possibility is that we’ve all been borrowing recklessly and living wildly beyond our means. But there are other possibilities too. Your debt-to-income ratio will go up if (a) your debt increases or (b) your income declines, and that can happen in several ways:
- If you borrow more, your debt burden goes up.
- If interest rates go up, your debt burden goes up even if you’re borrowing the same amount as before.
- If your income goes down (or grows more slowly than it used to, preventing you from paying down your debt at previous rates), your debt-to-income ratio increases.
- If inflation falls, your debt level doesn’t erode as quickly and your debt-to-income ratio may increase.
So which is it? Josh Mason and Arjun Jayadev recently decided to take the standard formula for decomposing public-sector debt changes and apply it to household debt over the past century or so. What they discovered was that although households did increase their borrowing during the housing bubble era (2000-06), that hasn’t been a general trend over the past few decades. It’s the other stuff that’s changed:
If interest rates, growth and inflation over 1981-2011 had remained at their average levels of the previous 30 years, then the exact same spending decisions by households would have resulted in a debt-to-income ratio in 2010 below that of 1980, as shown in Figure 2. The 1980s, in particular, were a kind of slow-motion debt-deflation, or debt-disinflation; the entire growth in debt relative to earlier periods (17 percent of household income, compared with just 3 percent in the 1970s) is due to the slower growth in nominal income as a result of falling inflation.
….Neither the 1980s nor the 1990s saw an increase in new household borrowing — on the contrary, the household sector in the aggregate showed a primary surplus in these decades, in contrast with the primary deficits of the postwar decades. So both the conservative theory explaining increased household borrowing in terms of shorter time horizons and a general lack of self-control, and the liberal theory explaining it in terms of efforts by those further down the income ladder to maintain consumption standards in the face of a falling share of income, need some rethinking.
In some sense, you can say that people got accustomed to a certain level of borrowing in the immediate postwar era and then kept it up in the Reagan-Volcker-Greenspan era. Unfortunately, they didn’t realize that the world had changed. Or, more accurately, they didn’t realize how much it had changed. In particular, they didn’t realize that growth was going to be permanently slower, inflation was going to be permanently lower, and wage growth was going to slide inexorably toward zero. So even though household borrowing went down over time, it didn’t go down nearly enough. The chart below shows how much the debt-to-income ratio has increased in real life (black line) vs. how much it would have increased with the same level of borrowing but under the financial conditions of the postwar era (red line):
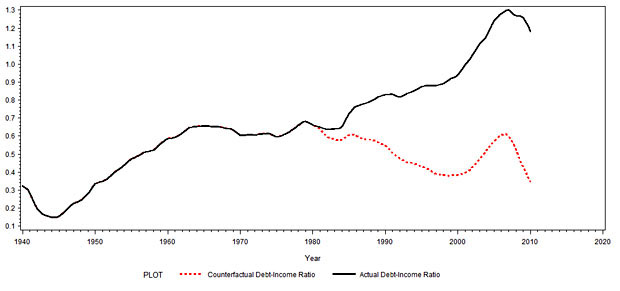
Based on this, Mason and Jayadev conclude that hectoring households about their borrowing habits isn’t going to have much effect:
Going forward, it seems unlikely that households can sustain large enough primary deficits to reduce or even stabilize leverage….As a practical matter, it seems clear that, just as the rise in leverage was not the result of more borrowing, any reduction in leverage will not come about through less borrowing. To substantially reduce household debt will require some combination of financial repression to hold interest rates below growth rates for an extended period, and larger-scale and more systematic debt write-downs.
At a guess, more systematic write-downs are not in the cards. Deleveraging is thus going to be a very slow, very painful slog that will depress economic growth even below the sluggish rates we’ve gotten used to over the past 30 years. Welcome to the future.


