Paul Krugman says that although the employment picture is looking up, it still has a ways to go. To illustrate this, he displays a chart showing the employment-population ratio for prime age workers age 25-54:
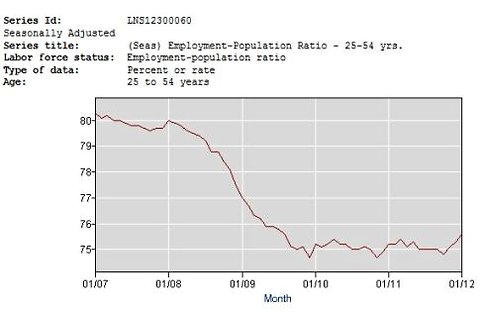
I agree that this is a telling statistic. It really does indicate that we haven’t made up much of the ground we’ve lost since 2007, so I don’t have any argument with Krugman using it. At the same time, you get a different picture if you pull back and disaggregate the data a bit. Here’s another view:
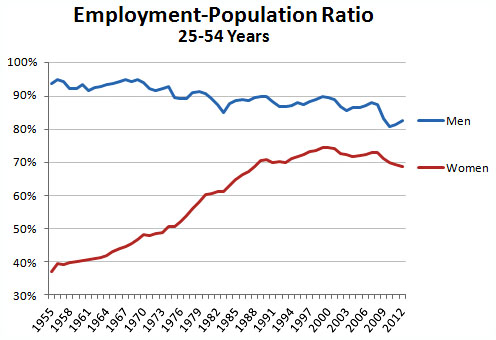
I don’t want to make too much of this, especially since I’m not sure exactly what we should make of it. But the employment-population ratio among men has been declining steadily for over half a century, and right now we’re only a point or two below the trendline for men. Conversely, participation among women plateaued starting in the mid-90s, which suggests that we’re still a good four points or so below the trendline for women.
Maybe. The question is what the long-term trend really is. I’m not sure what to say about that, but it’s been niggling at me for a very long time. Basically, I just want to caution everyone not to treat 2007 as a magic year. There’s no question that employment is still in the doldrums, but the question of where the employment-population ratio “should” be is not easy to pinpoint.