Josh Marshall is highlighting yet again a new study that demonstrates a large effect of strict photo ID laws on minority turnout. So why haven’t I? Because I honestly can’t makes heads or tails of it. Here are the authors:
In the general elections, the model predicts Latino turnout was 10.3 points lower in states with photo ID than in states without strict photo ID regulations, all else equal. For multi-racial Americans, turnout was 12.8 points lower under strict photo ID laws. These effects were almost as large in primary elections. Here, a strict photo ID law could be expected to depress Latino turnout by 6.3 points and Black turnout by 1.6 points.
Do you notice something missing? They mention Latinos and multi-racial voters in general elections, but not blacks. Why not? Apparently because of this:
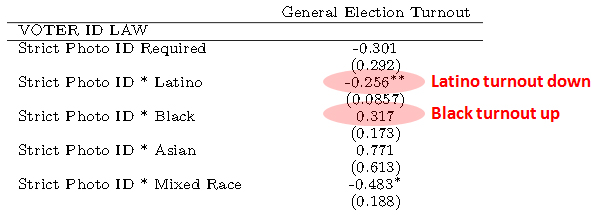
Their regression suggests that black turnout was up in states with strict photo ID laws. For some reason, though, the result isn’t statistically significant, so they ignore it. Conversely, their result for primaries shows black turnout down. But even though it’s a weaker result, it is statistically significant, so they report it.
And there are other things that make no sense. Not only do the authors report numbers for depressed turnout that are far larger than anyone has gotten before, but they suggest that photo ID laws cause black turnout to rise while mixed-race turnout declines. That’s pretty hard to fathom.
There are other problems. Their charts are incomprehensible. They rely on data collected over the internet. And the results in this paper are precisely the opposite of what one of the authors reported just a year ago in a paper using the same methodology: namely that strict photo ID laws do depress overall turnout, but don’t depress minority turnout any more than white turnout (“there is little evidence that racial minorities are less likely than Whites to vote when states institute voter identification requirements”).
Beyond that, the authors have applied so many controls that it’s hard to tell if there’s any real data left by the time they’re done. Check this out:
We also control for individual demographic characteristics…age…education level…family income…nativity…gender, marital status…having children, being a union member, owning a home, being unemployed, and religion…and whether the respondent was registered to vote in the pre-election survey…We also have to incorporate other state level electoral laws…early voting…all-mail elections…no excuse absentee voting…the limit on the number of days before the election that residents can register to vote….Finally, to help identify the independent effect of ID laws, our analysis has to include the electoral context surrounding each particular election…political competitiveness of each state…the presence of different electoral contests…whether the Senatorial and Gubernatorial contests are open seats or not, whether the Senatorial and Gubernatorial contests are uncontested or not, and finally the region (South or not).
Holy hell! I wonder how they decided on these controls rather than others? They don’t say.
It’s quite possible that the analysis in this study is too sophisticated for me to understand. I’m hardly a statistical guru. In fact, I can’t even tell precisely what their regressions are measuring. The numbers in the table don’t seem to bear any relationship to the results reported in the text. So maybe I just have no idea how to read this stuff.
But for now, I’d take this with a huge grain of salt until someone with the right chops weighs in on it. I don’t doubt that strict photo ID laws depress turnout among minorities, but I doubt very much the effect is as big as this study suggests.


