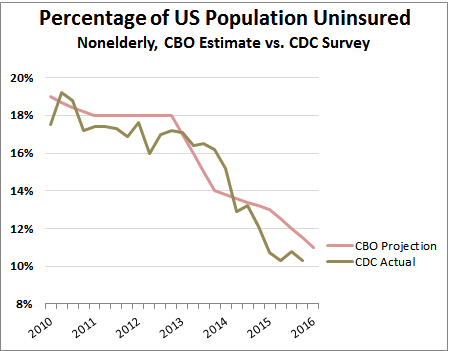
 The latest CDC figures on the uninsured are out, and after a small uptick last quarter they were back down again by the end of 2015. The uninsured rate clocked in at 10.3 percent,1 compared to a projection of 11 percent from the CBO back in 2012 (this was the projection published after the Supreme Court made Medicaid expansion optional but before the exchanges were up and running). This means that Obamacare has been consistently running ahead of projections for the past two years.
It’s worth noting, of course, that this number could be even lower. If red states adopted the Medicaid expansion, the number of uninsured would likely be around 8 percent or so. Also: among the poor, the number of uninsured has plummeted under Obamacare, from above 40 percent to below 25 percent. Needless to say, this number would plummet even further if red states were willing to accept federal money to help the poor. But they aren’t.
1You may have seen news reports that the uninsured rate was 9.1 percent. That number includes everyone, including the elderly, who bring down the average because they basically have a 0 percent uninsurance rate. I use the nonelderly rate because that corresponds to the original CBO estimates.


