U.S. immigration law — and U.S. immigration statistics — makes a big distinction between full-blown deportations (“Removals”) and “voluntarily” returning home under the threat of full-blown deportation (“Returns”).
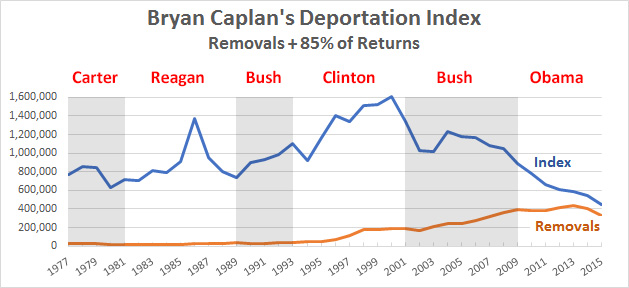
The distinction is not entirely cosmetic. If you re-enter after Removal, you face a serious risk of federal jail time if you’re caught. If you re-enter after a mere Return, you generally don’t. But Return is still almost as bad as Removal, since both exile you from the country where you prefer to reside. Since I’ve previously suggested that we should count each Return as 85% of a Removal, I’ve constructed a “Deportation Index” equal to Removals + .85*Returns to capture the substance of U.S. immigration policy. Check out the numbers:
No, no, no. I love ideas like this, but it demands a visual presentation. Here it is:

Under Obama, removals were much higher than any other president. However, there were far fewer returns. Thus, “deportations” were higher than any other president, but the total number of people who were actually sent home was lower than any other president.
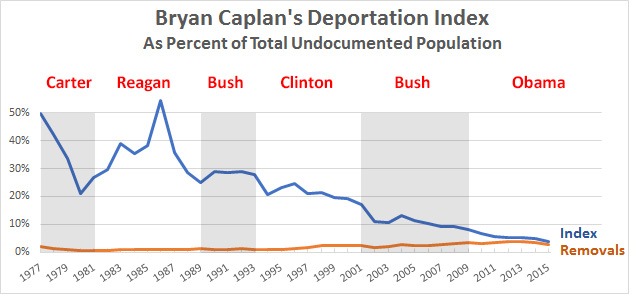
The next step is to calculate this as a percentage of the number of illegal immigrants in the country each year. Here it is:

This is approximate, since the total population of illegal immigrants is a little fuzzy before 2000. But it’s close enough. Obama still has a higher removal rate and a lower index rate than any other president, but the winner for the title of Deporter-in-Chief is…Ronald Reagan. Every president since then has been successively more tolerant of a large undocumented population.


