High school students are protesting guns, and that’s prompted some folks to dredge up a decade-old tweet from NRA flack Dana Loesch:
Teenagers piss me off.
— Dana Loesch (@DLoesch) May 29, 2008
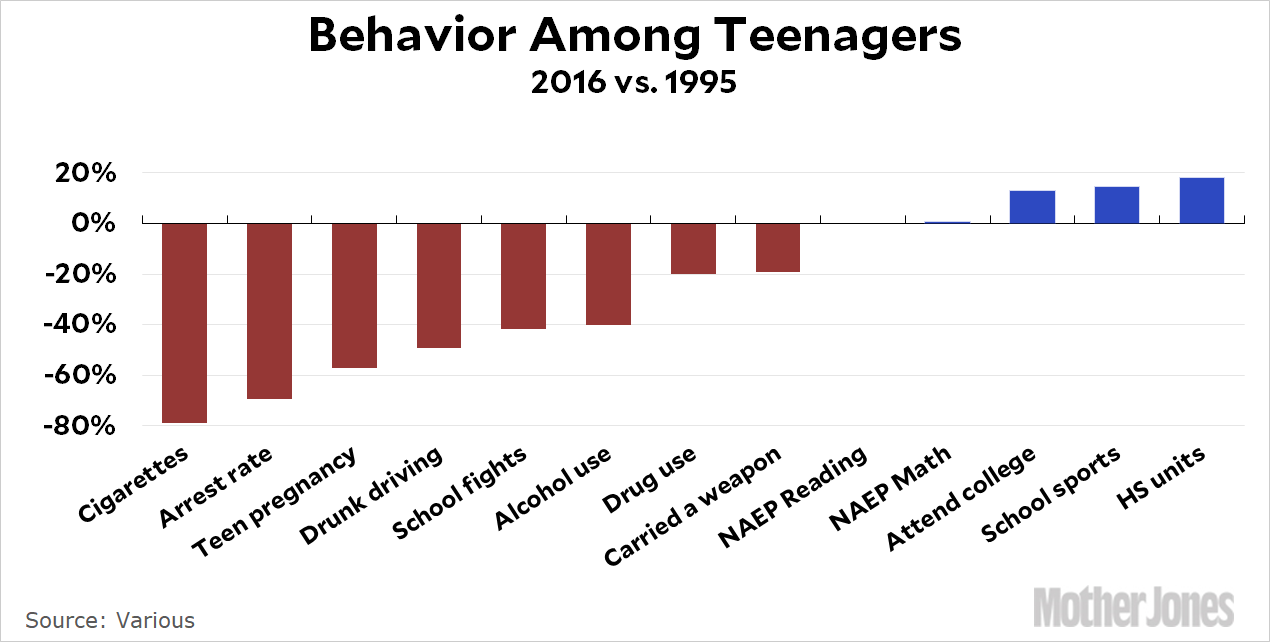
They can be annoying, all right, especially when they’re protesting guns. But all jokes aside, it’s worth being in awe of just how much better today’s teenagers are than those of Loesch’s era. Naturally, I’ve got a chart:

Bad behaviors have declined substantially since the mid-90s and good behaviors have increased. It’s pretty astonishing how widespread this is. They may annoy us with their smartphones and insistence on doing good works, but they’re in a helluva lot better shape than us Boomer/Gen X folks ever were.
SOURCES:
- Cigarettes: National Survey on Drug Use and Health (1995 here, 2016 Table 2.2B here). 12-17 year-olds reporting cigarette use in past month: 4.2% vs. 20%.
- Arrest rate: Dept. of Justice here. Raw arrest rates, 1995-2016: 2,553 per 100,000 vs. 8,228 per 100,000.
- Teen pregnancy: Dept. of Health & Human Services here. 15-19 year-olds, 1995-2014: 24.2% vs. 56%.
- Drunk driving: CDC National Youth Risk Behavior Survey, 1995 here, 2015 here: 7.8% vs. 15.4%.
- School fights: NYRBS. Physical fight within past 12 months: 22.6% vs. 38.7%.
- Alcohol use: Same as cigarettes.
- Drug use: National Survey on Drug Use and Health (1995 here, 2016 Table 1.2B here). 12-17 year-olds reporting any illicit drug use in past month: 8.8% vs. 11%.
- Carried a weapon: NYRBS. Carried a weapon at least once in past 30 days: 16.2% vs. 20.0%.
- NAEP reading: Long-term NAEP assessment here, 17-year-olds, 2012 vs. 1994: 289 vs. 288. Note that two points were added to 2012 scores to compensate for assessment format changes.
- NAEP math: NAEP. Scale scores: 308 vs. 306.
- Attend college: National Center for Education Statistics here. Percent of recent high school completers enrolled in college: 69.8% vs. 61.9%.
- School sports: NYRBS. Played on at least one sports team run by school or community group: 57.6% vs. 50.3%.
- High school units: NCES here, 1987-2009. Average number of Carnegie units earned by public high school graduates: 27.15 vs. 23.00.


