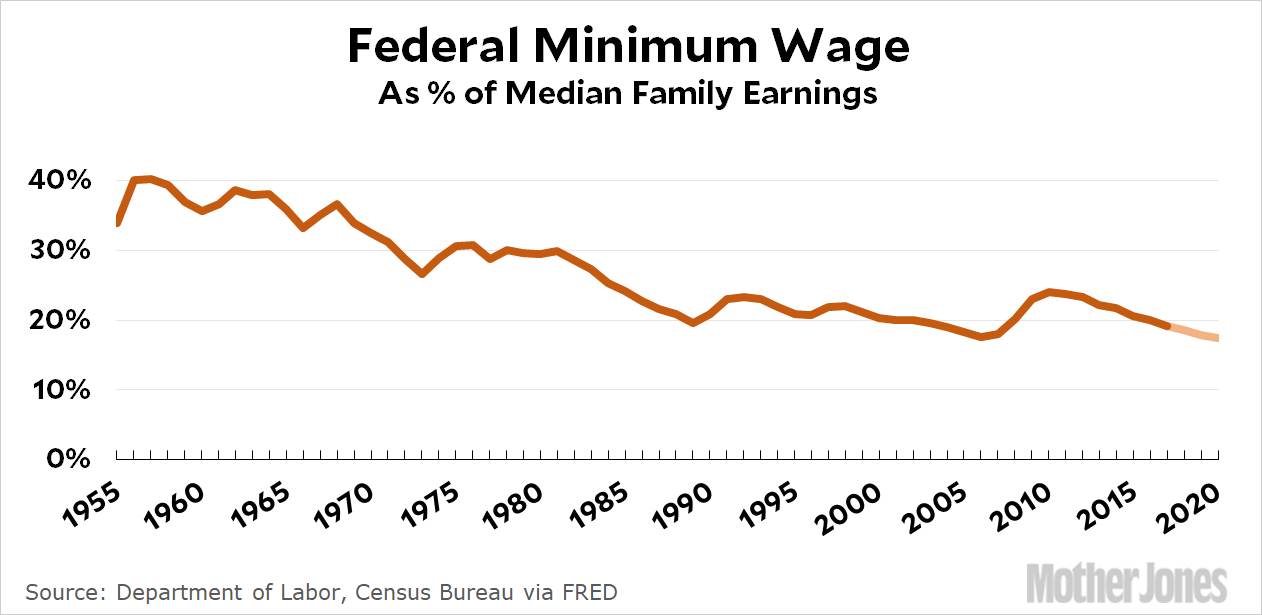
Charts showing the history of the minimum wage usually adjust for inflation, which always begs the question of which inflation measure is “most accurate.” But the best way to see the trend of the minimum wage is to simply compare each year’s level to the median family income in the same year. Here it is:

This view has less of the familiar sawtooth pattern, and shows that the federal minimum didn’t really peak in the 60s and then decline. In reality, it’s been slowly declining ever since we started collecting income statistics in the 50s. Back then, a full year of minimum-wage work earned you about 40 percent of the median. Today that’s down to 20 percent, and on current trends the minimum wage will decline to its lowest point in history by next year.
For all practical purposes, Republicans have finally reached a long-cherished goal: to eliminate the federal minimum wage. Today, thanks to their unwillingness to support an increase, well under one percent of workers earn the federal minimum wage, which makes it effectively meaningless.
Thanks, GOP! I’m sure your wealthy donors appreciate your flat refusal to entertain even a modest bit of help for the working poor and the working class, instead spending all your energies on tax cuts for corporations and the rich.


