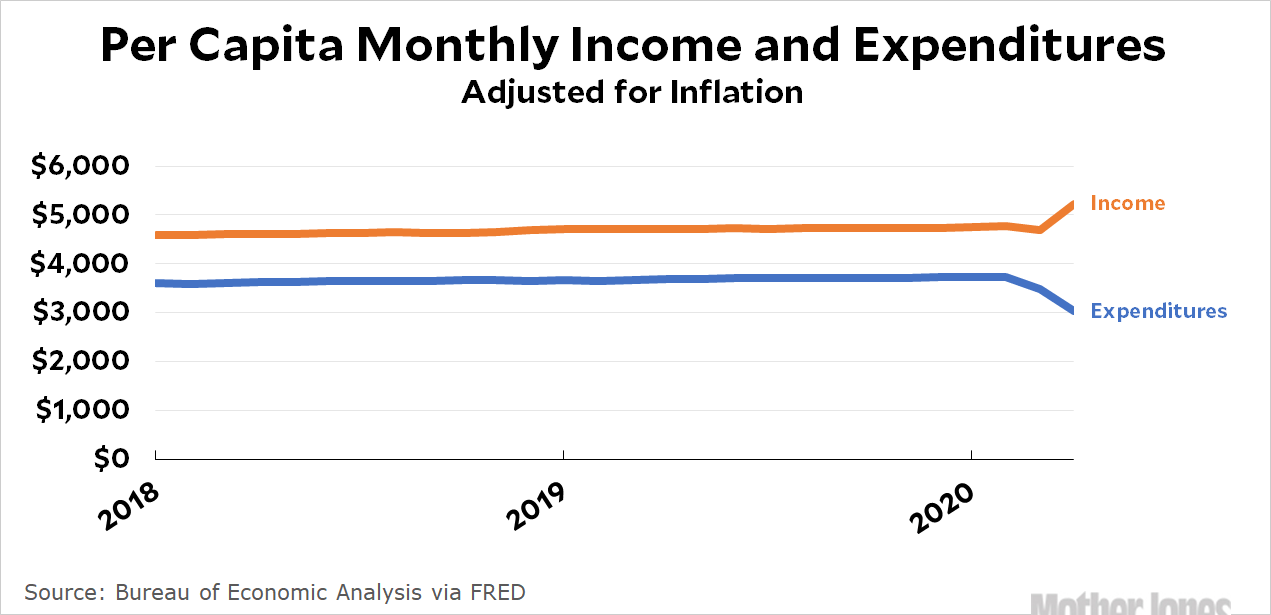
Between the dex and the news, I don’t really trust either my emotions or my judgment for the time being. So instead of saying anything about the appalling news of the past couple of days I’m going to bury myself in charts. I’ve got two for you, and for what it’s worth, they represent genuinely good news. First off, here are personal income and personal expenditures in April:

It’s no surprise that spending is down, but you might be surprised that income is up. How can that be? The answer is simple: the coronavirus stimulus bill sent everyone a $1,200 check and funded a $600 per week bonus for everyone getting unemployment insurance. The result of this is that many of the working poor saw their incomes go up even though they lost their jobs. This in turn pushed up the average.
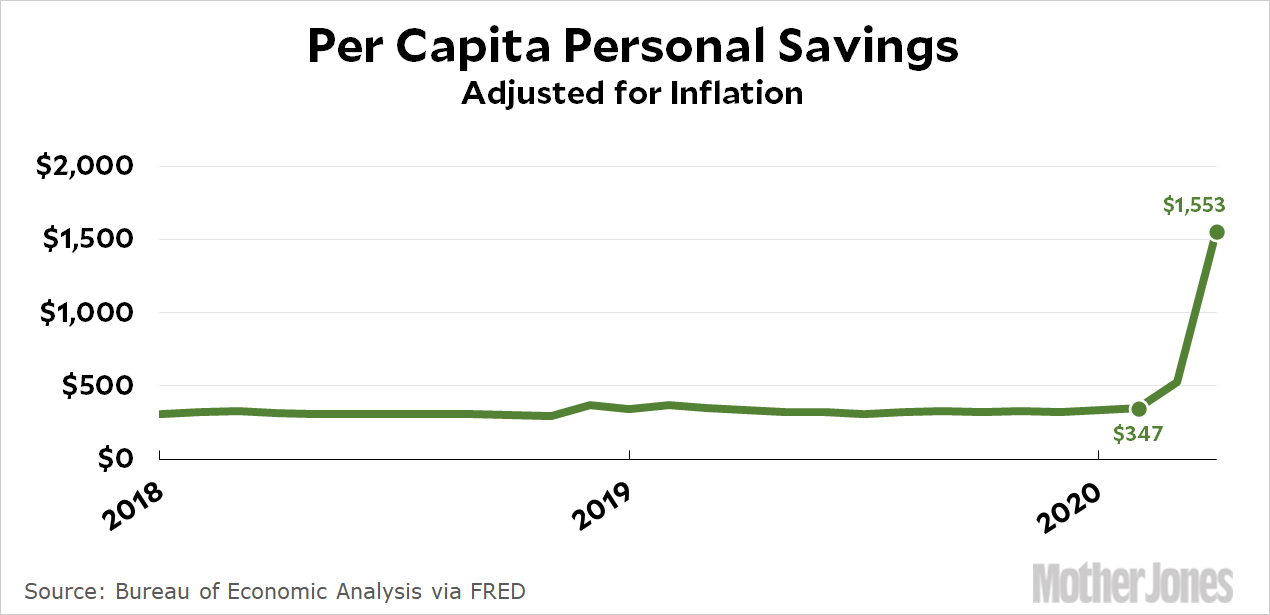
But if income is up and expenditures are down, this must mean that savings have skyrocketed:

The good news here is conditional. If we get COVID-19 under control so that jobs return and people aren’t afraid to go out and spend money, we have a tremendous amount of savings on the sideline just waiting to be spent. And keep in mind that this is only through April. We can expect the savings rate to stay at a high level in May and June.
This is plenty to power a recovery from the artificial recession we’re in now. But only if the pandemic is under control. Fiscally, we’ve done the right thing. Epidemiologically, the jury is still out.
UPDATE: I originally showed these figures on an annual basis. I’ve changed both charts to show everything on a monthly basis.


