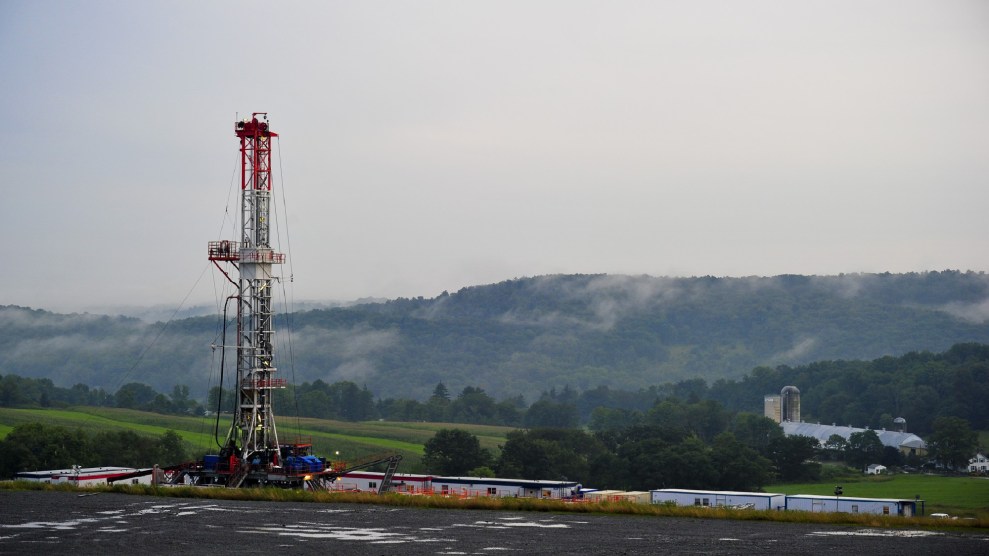
A country’s natural wealth often doesn’t trickle down to its citizens. This “resource curse” particularly plagues the world’s largest oil producing states. The chart below illustrates how the curse affects this small club and its newest member, Equatorial Guinea. – Michal Lumsden
|
Country |
Daily oil production (thousands of barrels) |
Corruption ranking** |
Political rights / civil liberties ratings*** |
Development ranking* |
Average annual per capita income |
Annual per capita health expenses |
Life expectancy |
Infant mortality (per 1,000 births) |
|
Saudi Arabia |
9,817 |
71 |
7/7 |
73 |
$8,530 |
$375 |
72 |
23 |
|
Russia |
8,543 |
90 |
5/5 |
63 |
$2,610 |
$115 |
67 |
18 |
|
Iran |
3,852 |
87 |
6/6 |
106 |
$2,000 |
$363 |
70 |
35 |
|
Venezuela |
2,987 |
114 |
3/4 |
69 |
$3,490 |
$307 |
74 |
19 |
|
Nigeria |
2,185 |
144 |
4/4 |
152 |
$320 |
$15 |
52 |
110 |
|
Algeria |
1,857 |
97 |
6/5 |
107 |
$1,890 |
$73 |
69 |
39 |
|
Libya |
1,488 |
108 |
7/7 |
61 |
N/A |
$143 |
72 |
16 |
|
Angola |
885 |
133 |
6/5 |
164 |
$740 |
$31 |
40 |
154 |
|
Azerbaijan |
313 |
140 |
6/5 |
89 |
$810 |
$8 |
72 |
74 |
|
Equatorial Guinea |
249 |
N/A |
7/6 |
116 |
$930 |
$76 |
49 |
101 |
|
United States |
7,454 |
17 |
1/1 |
7 |
$37,610 |
$4,887 |
77 |
7 |
*out of 175 countries, 1=highest
** out of 146 countries, 1=least corrupt
*** 1= most free, 7= least free
All figures based on most current available numbers.
Sources: British Petroleum 2004 Statistical Review of World Energy (oil production), Freedom House (political rights, civil liberties ratings), Transparency International (corruption ranking), United Nations Human Development Report (development ranking, health expenditures, life expectancy, infant mortality), World Bank (per capita income, health expenditures)


