• Chart of the Day: Net New Jobs in December


    The American economy added 292,000 new jobs last month, 90,000 of which were needed to keep up with population growth. This means that net job growth clocked in at a brisk 202,000 jobs—nearly all of it in the private sector. The headline unemployment rate stayed steady at 5.0 percent. This is a pretty strong showing, and it was all good news. Nearly 300,000 people re-entered the labor force and the participation rate ticked up a bit. This strong jobs report was due entirely to people finding jobs, not to people dropping out of the labor force.

    Disappointingly, this didn’t produce much wage growth. Hourly earnings of production and nonsupervisory employees went up at an annual rate of about 1 percent. For the year, earnings were up 2.4 percent—OK but not great. Job growth at the level of the last few months isn’t spectacular, but it’s pretty strong, and it should start translating into wage gains soon if it keeps up.

  • Good News: Labor Compensation Is Finally Starting to Rise


    When I was making a case this morning that America is actually in pretty good shape, probably the biggest pushback I got was about wages. And I agree that on the economic front, that’s still our biggest problem. Unemployment is relatively low, but thanks to modest GDP growth and the long-term unemployed continuing to re-enter the workforce, the labor market hasn’t been tight enough to push wages up.

    Still, the news isn’t entirely bad on this front. Cash wages remain pretty sluggish, but total compensation has risen nicely over the past five quarters. If this keeps up—and if health care costs continue to rise slowly—this will start to spill over into hourly wages. There are still plenty of things that could go wrong, and the weak growth of middle class wages remains our biggest long-term challenge, but there’s at least a glimmer of hope on this front. We may finally be truly starting to recover from the Great Recession.

  • Sunset in Irvine


    Here in California, we have great reproductive rights and great sunsets!

    In reality, tonight’s sunset was only nice, not especially striking. But I was playing around in Photoshop and applied the haze filter even though there was no haze in the picture. This gave it a lovely sort of JMW Turner drama—assuming Turner had painted in a well-manicured American suburb, that is. Alternatively, you can apply a brush stroke filter for even more of a fake Turner look. Well done, Photoshop!

  • Lead and Crime: Another Look


    A trio of researchers from the University of Missouri and the University of Iowa have a new paper out that calls into question the correlation between lead emissions and violent crime rates. I want to comment on it, but with two caveats:

    • I’m not knowledgeable enough to judge the analysis in detail. I can explain what the authors have done, and I can point out some questions, but that’s about it. Serious critiques will have to come from qualified researchers.
    • This post isn’t hard to follow, but it’s pretty long and the payback is slim. For that reason, I’m putting it under the fold. Click if you want to wade through the whole thing.

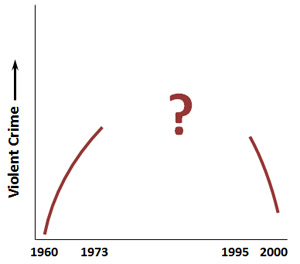
    With that out of the way, here’s a rough sketch of the issue. There’s broad agreement about what happened to violent crime in the 60s (it went up dramatically) and the 90s (it went down dramatically). The stylized chart on the right shows this. The question is: what happened in between?

    The problem is that there are two sources of data on violent crime (murder, rape, robbery, and aggravated assault). The first is the FBI’s Uniform Crime Report (UCR), which depends on reports from police departments around the country. The nice thing about the UCR is that it goes back a long way and the data is broken down by city. The bad thing about the UCR is that it can show spurious trends if police departments report crimes differently over time.

    This is especially a problem with rape and aggravated assault. In the case of rape, we know that women became more likely to report rape over the past 50 years, and we also know that police departments took rape reports more seriously. So even if rape rates hadn’t changed at all, we’d probably still see an increase in the numbers.

    In the case of aggravated assault, there’s no firm rule for what makes an assault “aggravated.” So it’s possible that the UCR numbers might be tainted simply because police departments have changed their standards for what counts as aggravated assault. This is a potentially serious problem since aggravated assault is one of the biggest components of overall violent crime rates.

    So that’s the UCR. The second source of crime data is the National Crime Victimization Survey (NCVS), which relies on interviews with families to ask them if they’ve been victims of a crime. The nice thing about the NCVS is that it gets 
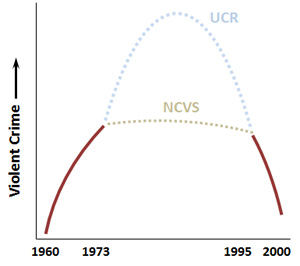
around the police reporting problem. The bad thing about the NCVS is that (a) it only goes back to 1973, and (b) surveys can have methodology problems too. In particular, there were several criticisms of the original NCVS that were addressed in a redesign that started up in 1993. So there are some known issues in the period from 1973-93.

    Why does this matter? Because when I fill in the chart with data from 1973-95, it looks way different depending on which source you use. According to the UCR, violent crime kept going up all through the 80s, reaching a peak in 1991. According to the NCVS, violent crime was declining modestly during this entire period.

    So which one is more accurate? There’s no way to know for sure, but the authors of the paper use the following methodology to arrive at a good guess:

    1. Take a look at the murder rate. The nice thing about murder (from a reporting standpoint) is that it’s almost always reported and it’s almost always clear cut. If you have a dead guy and it’s not a suicide, then it’s a murder. For that reason, everyone agrees on the murder rate.
    2. Make an assumption that murder and other violent crimes should follow a roughly similar pattern.
    3. Run the numbers to see which crime source correlates best with the murder rate. The authors conclude that NCVS correlates better and is therefore probably more accurate.
    4. Check to see if various theories of crime fit the NCVS data. The authors conclude that the lead hypothesis doesn’t. It fits the UCR data well, but not the NCVS data.

    I have a few comments about this study, but I want to emphasize again that I’m a layman. These aren’t serious methodological critiques. They’re just observations that I hope others will pick up on and look into. That said, here they are:

    • Can it really be true that violent crime was declining between 1973-91? There’s no question that this is what the NCVS data tells us, but it sure doesn’t match what everyone thought was going on at the time. By the early 90s, virtually everyone in America was convinced that (a) crime had been rising relentlessly for decades and (b) it would continue rising. (Remember “superpredators”?) At a purely gut level, a crime decline during this period sure doesn’t feel right.
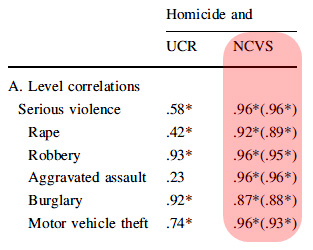
    • The correlations of murder and violent crime in the authors’ version of NCVS data seem almost too good to be true (see table on right). Every single one is above 0.87 and some are close to 1. Does it really make sense that murder should be almost perfectly correlated with motor vehicle theft?
    • On a related note, the authors’ estimate of the correlation of gasoline lead with violent crime is shockingly low: zero. At the very least, we know that both series show a dramatic decline during the 90s, which is a third of the period under investigation. It’s surprising that there isn’t at least a small correlation even with the NCVS data.
    • The lead-crime correlation only works for the entire period from approximately 1950 to 2000. If you pick out a subsection of that period, it’s not surprising that you might lose the signal. That’s especially true when you choose the middle of the period, a time when lots of cohorts all had extremely elevated lead levels. With levels that high among a broad swath of the population, it’s entirely possible that other factors were temporarily more important. (Just as they are now, when lead levels are low across the board.)
    • For what it’s worth, I got lots of critiques of my 2013 article on lead and crime, but no one ever suggested that using UCR data was a problem.

    One final note. If I had one thing to do over in my 2013 article, I think I’d dump the chart showing the overall national correlation between lead and crime (the subject of this paper). It’s obvious why it was included: it’s a visually dramatic statement, and historically speaking it was the observation that started research into lead and crime. But there’s a reason I wrote my 
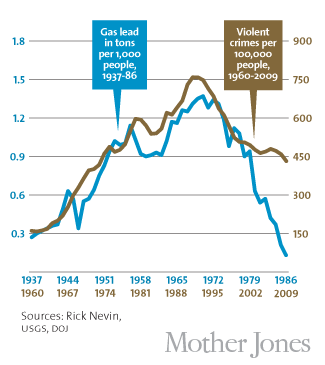
piece in 2013: that was when the evidence started really piling up in favor of the lead theory. The national correlation by itself would never have been enough to justify writing the piece. In fact, it’s easily the least important part of the whole argument, and placing it front and center did nothing except prompt endless choruses of “correlation is not causation!” from people who don’t read beyond the pictures. I wish I’d never included it.

    So what is important? On a statistical level, there are state-level correlations, city-level correlations, and, most importantly, international correlations. All of those together paint a very convincing picture. On an outcome level, there are prospective studies that track children with elevated lead levels. All of them show that they get arrested at higher rates the higher their childhood lead exposure. On a medical level, there are now brain scan studies that provide a plausible pathway for lead exposure to cause permanent neurological damage to parts of the prefrontal cortex associated with impulse control.

    So that’s that. I have questions about this study, but I don’t have the chops to provide any answers. Hopefully other researchers will comment on this paper and eventually guide us to some firmer conclusions.


  • Is Being a Modern Teen Really a Relentless Slog of Existential Angst?


    I was just at the bookstore, and on a whim I browsed through a bunch of “Teen Fiction” titles. Good God. I’ve never seen such a pile of depressing writing in my life. Everyone is sick, abandoned, kidnapped, bullied, overweight, comes from a broken family, survived a school shooting, or caught in the middle of a gothic horror. The horror books actually seemed the most uplifting.

    I dunno. Maybe they all have happy endings? In any case, if these books are typical of what teens read these days, I’m halfway surprised that any of them make it out of adolescence with their psyches intact.

    On the bright side, I learned a new word: Unputdownable. So it wasn’t a total loss.

  • It’s Time to Return to Market-Based Antitrust Law


    Tim Lee makes an interesting argument today. He notes that cell phone plans have gotten a lot better lately:

    Next time you go shopping for a new cellphone plan, you’re likely to find that the options are a lot better than they were a couple of years ago. Prices are lower. You don’t have to sign up for one of those annoying two-year contracts. You’ll probably get unlimited phone calls and text messages as a standard feature — and a lot more data than before.

    Why has this happened? Because for the past couple of years T-Mobile has been competing ferociously with cheaper, more consumer-friendly plans, and the rest of the industry has had to keep up. But what prompted T-Mobile to become the UnCarrier in the first place?

    Back in 2011, AT&T was on the verge of gobbling up T-Mobile, which would have turned the industry’s Big Four into the Big Three and eliminated the industry’s most unpredictable company….But then the Obama administration intervened to block the merger. With a merger off the table, T-Mobile decided to become a thorn in the side of its larger rivals, cutting prices and offering more attractive service plans. The result, says Mark Cooper, a researcher at the Consumer Federation of America, has been an “outbreak of competition” that’s resulted in tens of billions of dollars in consumer savings.

    After the AT&T deal fell through, T-Mobile needed a new strategy….So T-Mobile and its new CEO, John Legere, started changing a lot of things. In 2013, the company dropped the much-hated two-year contracts that had become an industry standard. It introduced a new price structure that offered unlimited phone calls and text messages as a standard feature….In 2014, T-Mobile added more goodies, including more generous data caps and unlimited international texting. It boosted its data caps once again in 2015.

    Antitrust law in America has been off track for decades, and it’s time to get back on. The government shouldn’t worry about trying to gauge price levels or consumer welfare or benefits to consumers. That’s like trying to centrally control the economy: we don’t know enough to do it well even if we want to. Instead, the feds should concentrate on one simple thing: making sure there’s real competition in every industry. Then let the market figure things out. There are exceptions here and there to this rule, but not many.

    Competition is good. Corporations may not like it, and they’ll fight tooth and nail for their rents. But it’s good for everyone else.

  • The Oxy Epidemic Shows What Happens When Addictive Drugs Are Easily Available


    Robert VerBruggen says he’s always had a libertarian view of drug policy: legalize ’em all. We’d get less incarceration, less gang and cartel violence, and an end to the war on drugs, all at a pretty modest cost.

    Then again, maybe not:

    Well, reality is not lining up with this view of the world. In 1999, Americans had fatal drug overdoses at a rate of 6 per 100,000. In 2014, that number stood at 14.8 per 100,000 — a rise of 8.8 per 100,000. To put this in perspective, America’s famously high homicide rate is about 5 per 100,000. And the overdose spike is apparently driven by a policy change much gentler than full legalization.

    The general consensus seems to be that in recent decades, doctors started taking patients’ pain more seriously, and thus began prescribing opioid painkillers more generously. Some patients became addicted; others got medications they didn’t need and sold them. (It appears that most addicts are not getting their drugs directly from a doctor.) Efforts to clamp down on this problem may have had an effect on painkiller overdose deaths — there was a dip in 2012 and 2013 — but 2014 saw another record high. Many addicts are switching to heroin, another opioid with a staggering and growing death toll.

    Now, extrapolating from this narrative, imagine if we completely legalized all drugs, not only removing the threat of incarceration but also dramatically driving down prices.

    The United States and Canada account for 83 percent of the worldwide consumption of oxycodone, the narcotic painkiller that’s caused the biggest addiction and overdose problems. No one else even comes close: Germany is in third place at 3.5 percent.

    VerBruggen is right: this is an indication of what might happen if all recreational drugs were legalized. It doesn’t have to be what happens, but the laws of economics don’t magically stop when it comes to drugs. If you lower the price dramatically—both in dollars and easier availability—then consumption is going to go up. And that’s going to mean more addiction and more death. Nobody can say for sure how much more, but the Oxy epidemic suggests it could be pretty substantial.

    On a related note, the famous Case/Deaton paper showing a rise in white mortality since 2000 breaks out three categories of death: suicides, liver disease (a proxy for alcohol abuse), and drug poisoning. All three have gone up, but poisoning has gone up far, far more than the others. The first two have increased about 50 percent since 2000. Poisoning has increased about 1,500 percent. This coincides with the period when Oxy became popular, and probably accounts for a big part of the difference between increased white mortality in America vs. other countries. Oxy is a famously white drug, and may also account for the fact that mortality has increased among whites but not blacks or Hispanics.

    And on another related note, the damage from the Oxy epidemic is worst among the poor and working class. It’s easy to favor drug legalization when you’re middle-class and well educated. Your social group probably doesn’t include many people who abuse drugs much in the first place. Moderate users can afford their habit. And when their use turns into addiction, they usually have a strong support network to help out. It’s a problem, but not a huge one.

    In poor communities, none of this is true. Drug addiction is financially ruinous. It often leads to petty crime. Support systems are nonexistent. The justice system is harsh. There are no rehab centers on the Malibu coast to help out. Drug epidemics—Oxy, meth, heroin, you name it—are devastating. It’s something to keep in mind when you consider both the costs and benefits of drug legalization. Ending the war on drugs would indeed be a huge benefit, but the costs might be higher than you think.

  • Why Didn’t Hillary Clinton Negotiate With North Korea?!?


    Over at National Review, Jim Geraghty quotes Michael Hirsh’s summary of Hillary Clinton’s attitude toward North Korea:

    Other pressing issues, such as North Korea’s nuclear program, she simply put off. Her policy of “strategic patience” with North Korea, under which Washington refused to offer any new incentives to Pyongyang in the hopes of restarting nuclear disarmament talks, did not work. The problem festered for four years, and as soon as Clinton left office, the North Korean leader Kim Jong Un greeted her successor with yet another nuclear test.

    Geraghty plainly disapproves of this. No incentives for nuke talks! But when we offered incentives for an actual nuclear freeze—to Iran—conservatives went ballistic. I can only imagine how they would have reacted if Hillary had done for North Korea what Geraghty is lamenting she failed to do.

    Flip-flop criticism of political opponents is pretty common. But it’s supposed to be a wee bit subtler than this. Come on, guys.

  • Griping Aside, America Is In Pretty Damn Good Shape

    David Sucsy/iStockphoto


    Yesterday at lunch, I was mulling over all the familiar laments we’ve heard this year about voter anger and America decline. And I thought: really, what’s so bad? I should write a post about this.

    Today I woke up, and in a remarkable example of precog telepathy, Politico’s Michael Grunwald had written almost exactly the piece I had in mind:

    Start with the economy….Unemployment has dropped from 10 percent during the worst of the Great Recession to 5 percent today….The housing market has also rebounded from the crisis, and after-tax corporate profits are at an all-time high….The oft-predicted doomsday scenarios of the post-crisis era—double-dip recession, runaway inflation, runaway interest rates, out-of-control energy prices, a health insurance death spiral, a Greek-style debt crisis, a run on the dollar—are still stubbornly refusing to materialize. Growth is modest but steady. Inflation is low….About 17 million uninsured Americans have gotten coverage in the past few years. The federal deficit has plunged from $1.4 trillion in 2009 to under $500 billion, while the dollar has gained strength against foreign currencies.

    ….Meanwhile, other recent developments—cheaper gas, free birth control and preventive care, the elimination of annual and lifetime caps on health insurance, expanded tax credits for the working poor, increased efficiency measures that lower energy bills, and much more—have put more money in the pockets of American families, even though their incomes have grown slowly.

    ….Crime in big cities dropped about 5 percent in 2015, and has been cut in half since 1990. The teen birth rate is down more than 60 percent since 1990….Carbon emissions have dropped 10 percent from 2005 levels. High school graduation rates are at an all-time high….And despite all the rhetoric about border crises and wall-building, America’s population of undocumented immigrants has remained stable for the past five years.

    ….Legislative gridlock in Washington eased significantly in 2015. After four years of divided-government paralysis, President Obama signed a slew of major bipartisan laws last year, including a bizarrely responsible reform of a long-standing Medicare funding problem and a sensible overhaul of the unpopular No Child Left Behind education law.

    There’s no need to be too Pollyannish, of course. Wages continue to be pretty stagnant. The Middle East is in flames. Reproductive rights are under sustained attack. Way too many unarmed blacks are being shot by police. Heroin use has become an epidemic. Etc.

    But generally speaking, Grunwald is right. America weathered the Great Recession better than Europe, better than China, better than Japan, better than Russia, better than just about anybody. Health care costs have been growing slowly and more people are covered than ever before. Taxes are low on the middle class. The tech revolution has delivered an insane—and surprisingly high quality—number of entertainment options available to almost anyone. Campaign rhetoric notwithstanding, American military strength is unmatched by anyone in the world, and it’s not even close. Telepathy has apparently been developed by the editors at Politico.

    That’s not bad, is it?

    POSTSCRIPT: Normal griping about all our problems will resume shortly. Don’t worry: I have not been taken over by aliens.