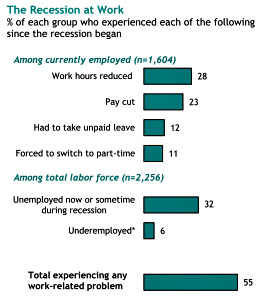
We already know that unemployment, long-term unemployment, and underemployment have been sky high during this recession, but a new study from Pew has some additional startling news: even among the still employed, 74% have taken a pay cut of  one kind or another,1 either directly or via forced time off — and it’s probably even worse than this since Pew apparently didn’t ask about cuts in benefits. I wonder: does this mean that wages among the currently employed aren’t as sticky as we think? And is this new? My sense is that we haven’t seen pay cuts of this breadth in previous recessions, even in 1981-82. But that’s just a sense. I don’t know if there’s survey data to back that up.
Other bullet points from the Pew study:
- More than six-in-ten Americans (62%) say they have cut back on their spending since the recession began in December 2007.
- About half the public (48%) say they are in worse financial shape now than before the recession began….Government data show that average household wealth fell by about 20% from 2007 to 2009, principally because of declining house values and retirement accounts. This is the biggest meltdown in U.S. household wealth in the post-World War II era.
- A third (32%) of adults now say they are not confident that they will have enough income and assets to finance their retirement, up from 25% who said that in February 2009.
- Throughout most of the decade of the 2000s, Republicans were significantly more upbeat than Democrats about the state of the economy. That pattern is now reversed.
That last point, by the way, almost certainly explains the different levels of economic optimism among various demographic groups. In all cases, the more Democratic trending group is also the most optimistic.
In other related news, homes sales are down, GM is selling fewer cars, jobless claims spiked last week instead of falling, and thanks to Ben Nelson (D–LetEmRot) unemployment benefits still haven’t been extended. Those benefits are only for losers in other states, after all. As long as Nebraska is doing OK, why should he be worried?
1A couple of commenters point out that the categories in the chart aren’t mutually exclusive. A single person might fall into more than one of them, so you can’t just add them up to get 74%. That’s true. So the real number is lower than this. At a guess, though, it’s still well over 50%.


