The Wall Street Journal reports that this could be one of the weakest spring homebuying seasons in a while. But this paragraph caught my eye:
The next few months are a critical test of the housing market, as buyers look to get into contract on a home before summer vacations and the new school year. About 40% of the year’s sales take place from March through June, according to the National Association of Realtors.
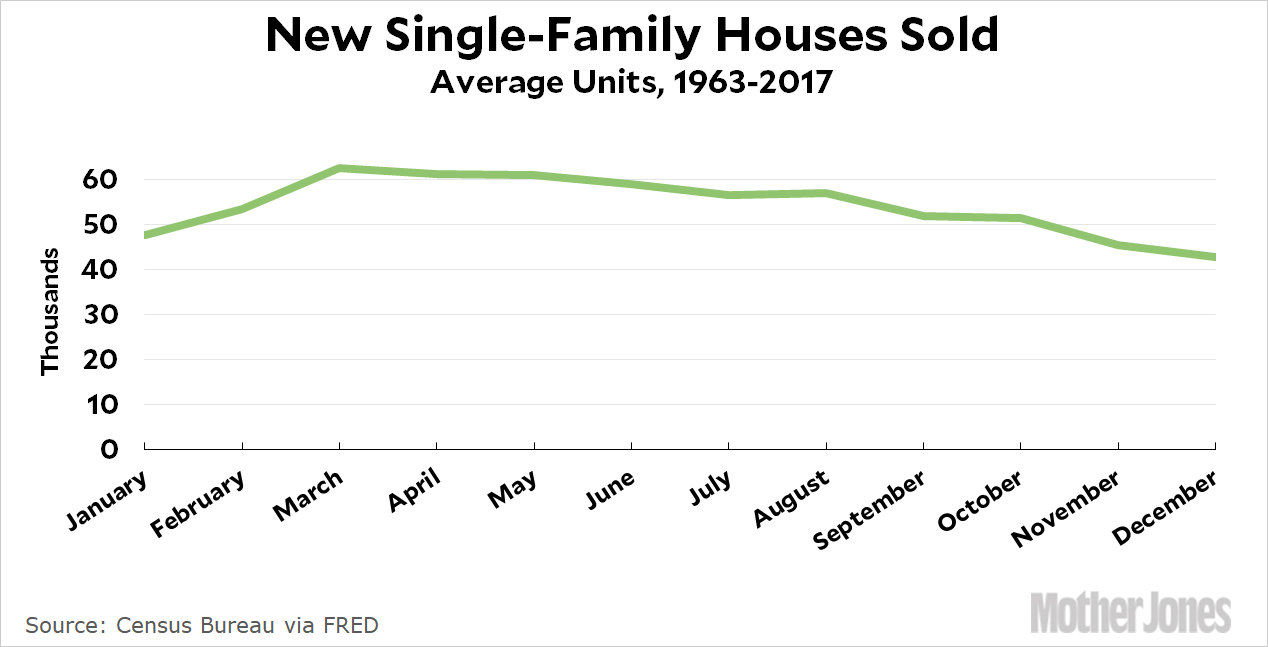
Wait. They’re saying that 40 percent of sales take place in 33 percent of the months. That doesn’t make spring sound all that critical. But it got me curious, so here’s a chart of average new home sales since 1963:

March-June is indeed the busiest period of the year. But not by much, really. The holiday season is obviously a laggard, but the entire rest of the year hovers between 50-60 thousand new homes per month. Since 1963, the March-June period has accounted for 37.5 percent of the year’s sales and July-October has accounted for 33.4 percent.
Now, this is sales of new homes only. Perhaps sales of existing homes are more seasonal? I’m not sure why they would be, but it’s possible. Unfortunately, that data is available only from the National Association of Realtors, which distributes only seasonally adjusted figures. That’s not of much use when you’re looking for seasonal trends.


