Mitt Romney.<a href="http://www.flickr.com/photos/seth/399340323/sizes/m/in/photostream/">/sethrubenstein/Flickr
Add another entry to the long-running list of GOP presidential candidate Mitt Romney’s flip-flops. At Sunday’s NBC/Facebook debate in Concord, Romney took a question about the nation’s woeful labor market and his criticism of President Obama’s economic plan. Romney tempered his attacks on Obama by noting, “I don’t blame him for the recession and the jobs crisis.”
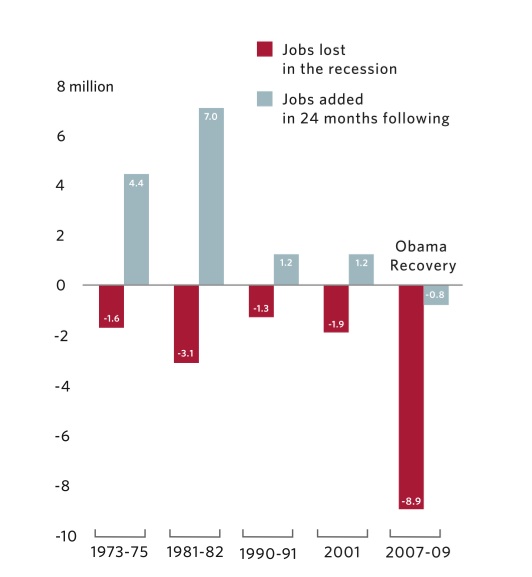
But in his campaign’s 87-page economic plan, Romney does just that. If you look closely at Romney’s depiction of the Great Recession and ensuing, lingering jobs crisis, he blames Obama for the nation’s jobs crisis. Released in September 2011, Romney’s plan highlights a period from 2007 to 2009, showing how during this period 8.7 million jobs were lost in the Great Recession and another 800,000 were shed in the immediate aftermath of the recession. Amazingly, Romney’s economic plan calls this period the “Obama Recovery.” Here’s the graph to prove it:
 Mitt Romney campaign.
It’s chart fraud at its finest. The years 2007 and 2008, of course, were the final two of the Bush administration. The jobs crisis was at its worst during those years, including a staggering 2.6 million jobs lost in 2008. And those years have nothing to do with the “Obama recovery.”
Nor was this Romney’s only misrepresentation of Obama’s jobs record. As Tim Murphy noted, Romney falsely claimed he created more jobs as governor of Massachusetts in the 2000s than Obama has as president. In reality, Romney used the same bogus math to make this claim as he did when blaming the the nation’s unemployment woes on Obama.


