

The Economist notes a “bizarre” relationship today:
For the last forty years the number of new houses built privately has been almost exactly one-tenth the total number of houses bought and sold in a given year. So, for example, if 1m houses are bought or sold in Britain next year (as seems likely) then you can expect about 100,000 houses to be built by private housebuilders.
This doesn’t actually seem all that strange to me. I’d guess that when the economy is good, there are both more houses built and more houses sold. It’s true, though, that the 10:1 relationship is surprisingly precise, which makes it intriguing. So that got me 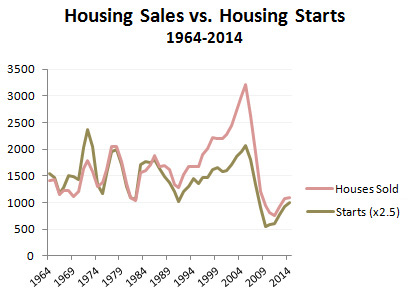 wondering: is the same thing true in the United States?
Sort of. If you’re not a housing expert—and I’m not—it’s a little tricky knowing exactly which data to use. I used Census Bureau data for houses sold and housing starts, and got the chart on the right. It shows a very close relationship except for the period 1997-2007, which corresponds to the great housing bubble. That makes sense: if there are a lot of transactions but just the usual amount of new construction, you’d expect prices to spike. And that’s what happened.
The other interesting thing is that the relationship in the US is about 2.5:1. The Economist claims that economists don’t know why this relationship exists, and then goes on to propose a fairly outré theory: Home builders in Britain tend to target the price of newly built houses at the upper 10 percent of local prices. Thus the 10:1 relationship.
I don’t get this, and the Economist writer doesn’t seem to get it either. If it’s true, though, it would mean that American home builders target the price of newly built houses at the upper 40 percent of local prices. Why the difference?
It’s a mystery. In fact, I’m not even sure why I wrote this post. Perhaps so that someone smarter than me (and the Economist) can explain what’s going on.


