Every tedious old argument in the world is being regurgitated lately in service of the final, desperate defense of the Republican health care bill. The latest hotness is the old “we’re not cutting, we’re just slowing the rate of growth” argument for Medicaid. So let’s make this easy. Here’s the basic chart of federal Medicaid spending since 2000:
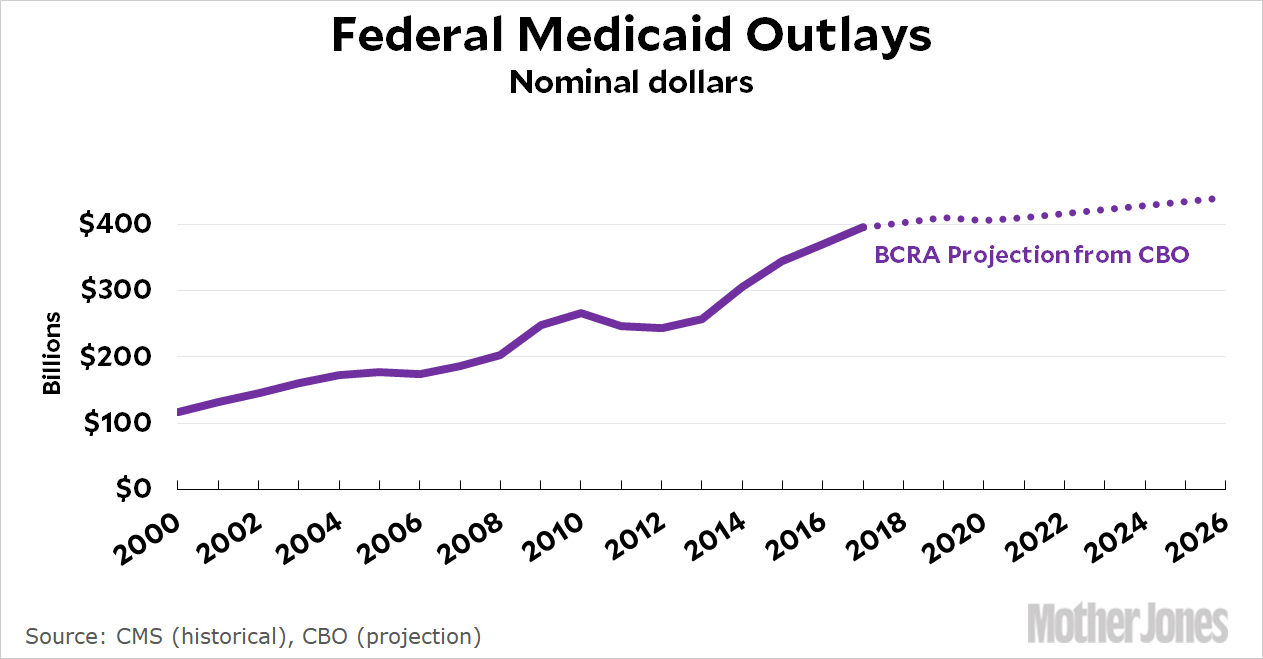
Sure enough, spending continues to rise under BCRA. But even a high school freshman knows that you have to adjust for inflation in any time series like this. Here’s the chart for real spending:
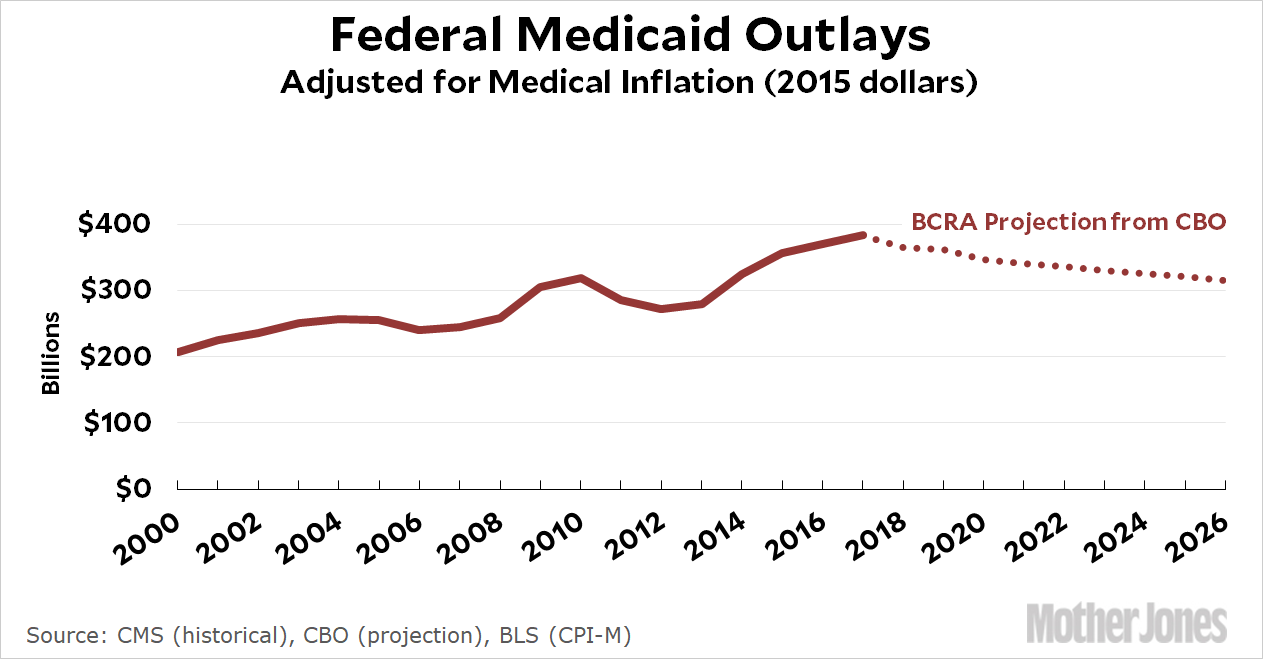
There’s a reason this is called real spending. As you can see, Medicaid spending isn’t “slowing down,” it’s being cut. Spending in 2026 is 18 percent lower than spending in 2017. And here’s the result:
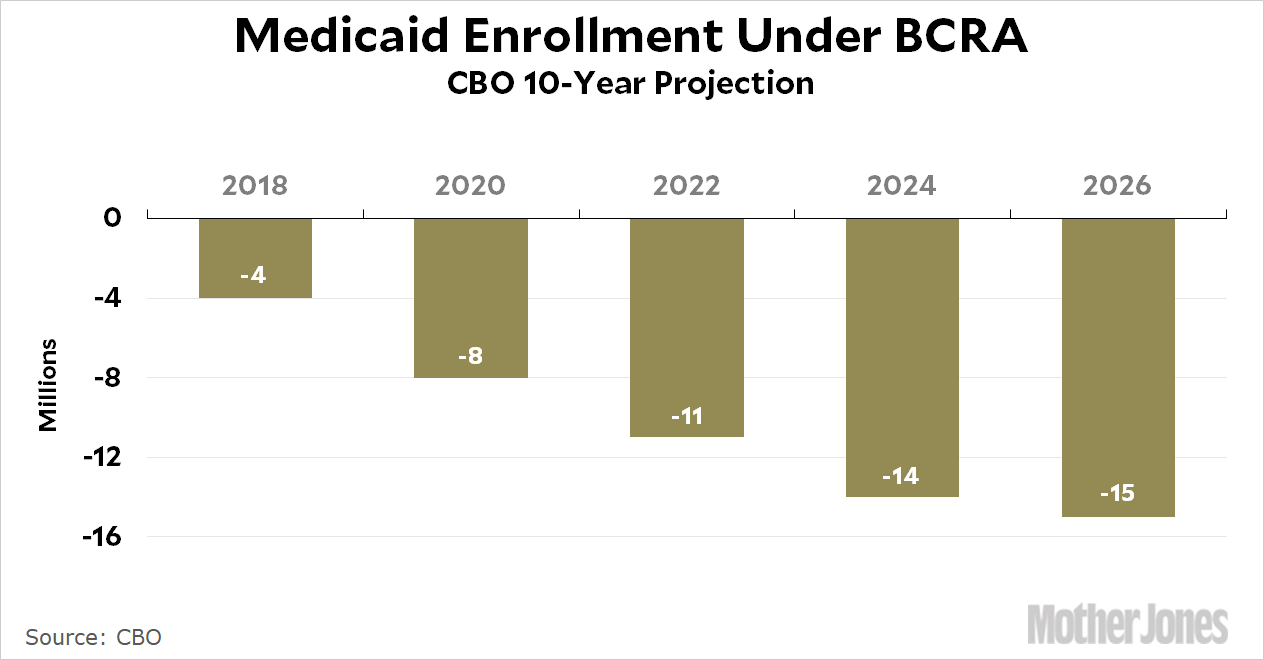
The CBO estimates that the reduced spending will result in 15 million fewer people receiving Medicaid. Unsurprisingly, that’s a reduction of about 18 percent. It’s pretty simple.
NOTE: Historical Medicaid spending from CMS here (NHE Table 3). CBO spending projection here (page 13). CPI-M here. I used a conservative 3 percent as the CPI-M over the next decade—a bit lower than the average over the past decade. CBO Medicaid enrollment projection here (page 17).


