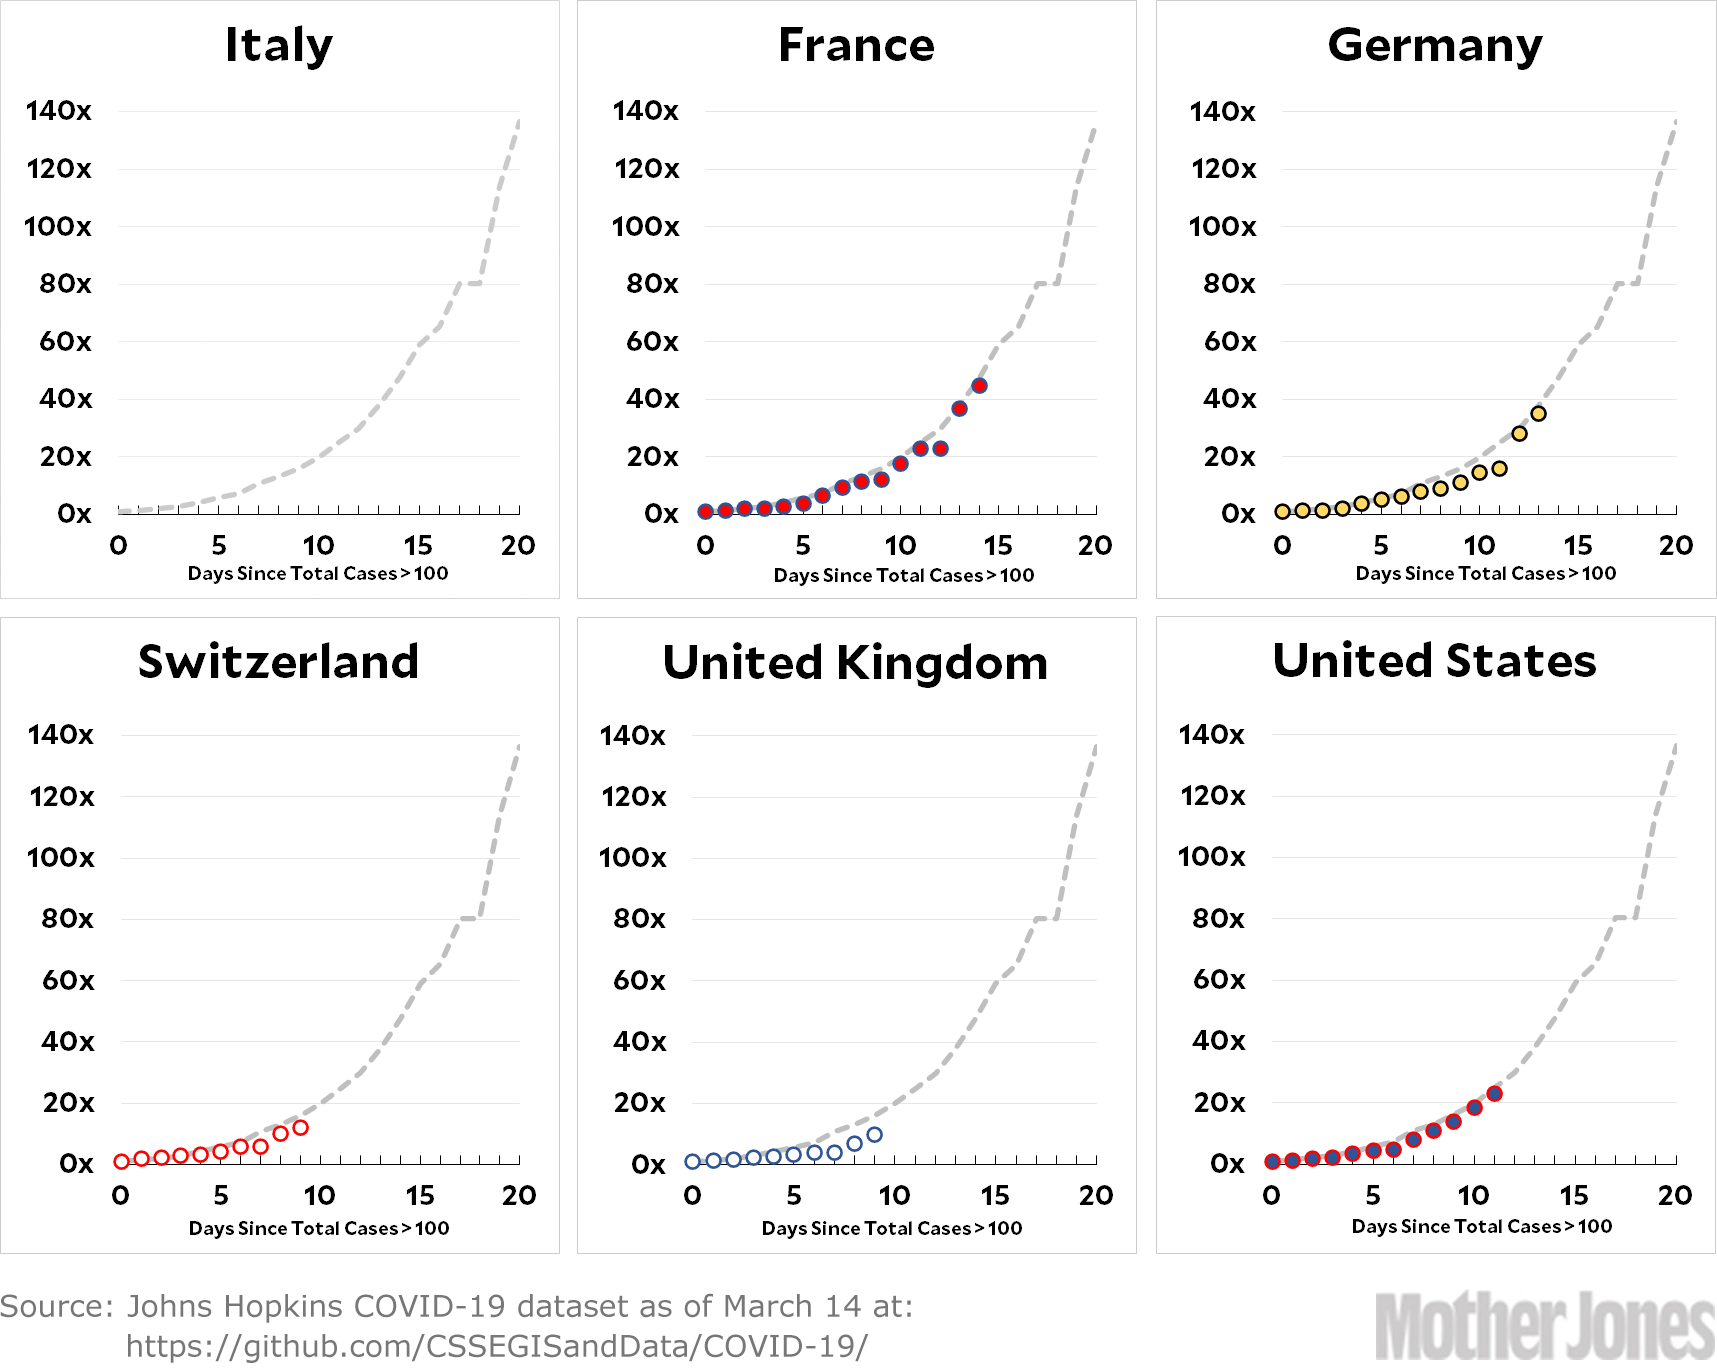
I’m not promising to do this every day, but having done it once it’s now fairly easy to update. Note that the y-axis on these charts now goes up to 140x because the base trendline from Italy has continued to grow. That will continue to go up until the number of new cases flattens out.
It’s worth noting that these growth rates are all based on official figures, and obviously they depend on how widespread testing is in various countries. The US numbers, for example, may be artificially low simply because we don’t have test kits available. We won’t know for sure until kits become widely available and we begin testing larger numbers of people.
Also worthy of note is that actions we take now will affect the growth of coronavirus a couple of weeks from now, but our growth rate over the next two weeks or so is probably set in stone no matter what we do. This is partly because of simple inertia in our public habits, and partly because the pool of victims that will be identified in two weeks already exists. They’re asymptomatic right now, but they won’t be for long. We should be preparing for a 10x increase in coronavirus cases over the next two weeks.
The raw data from Johns Hopkins is here.


