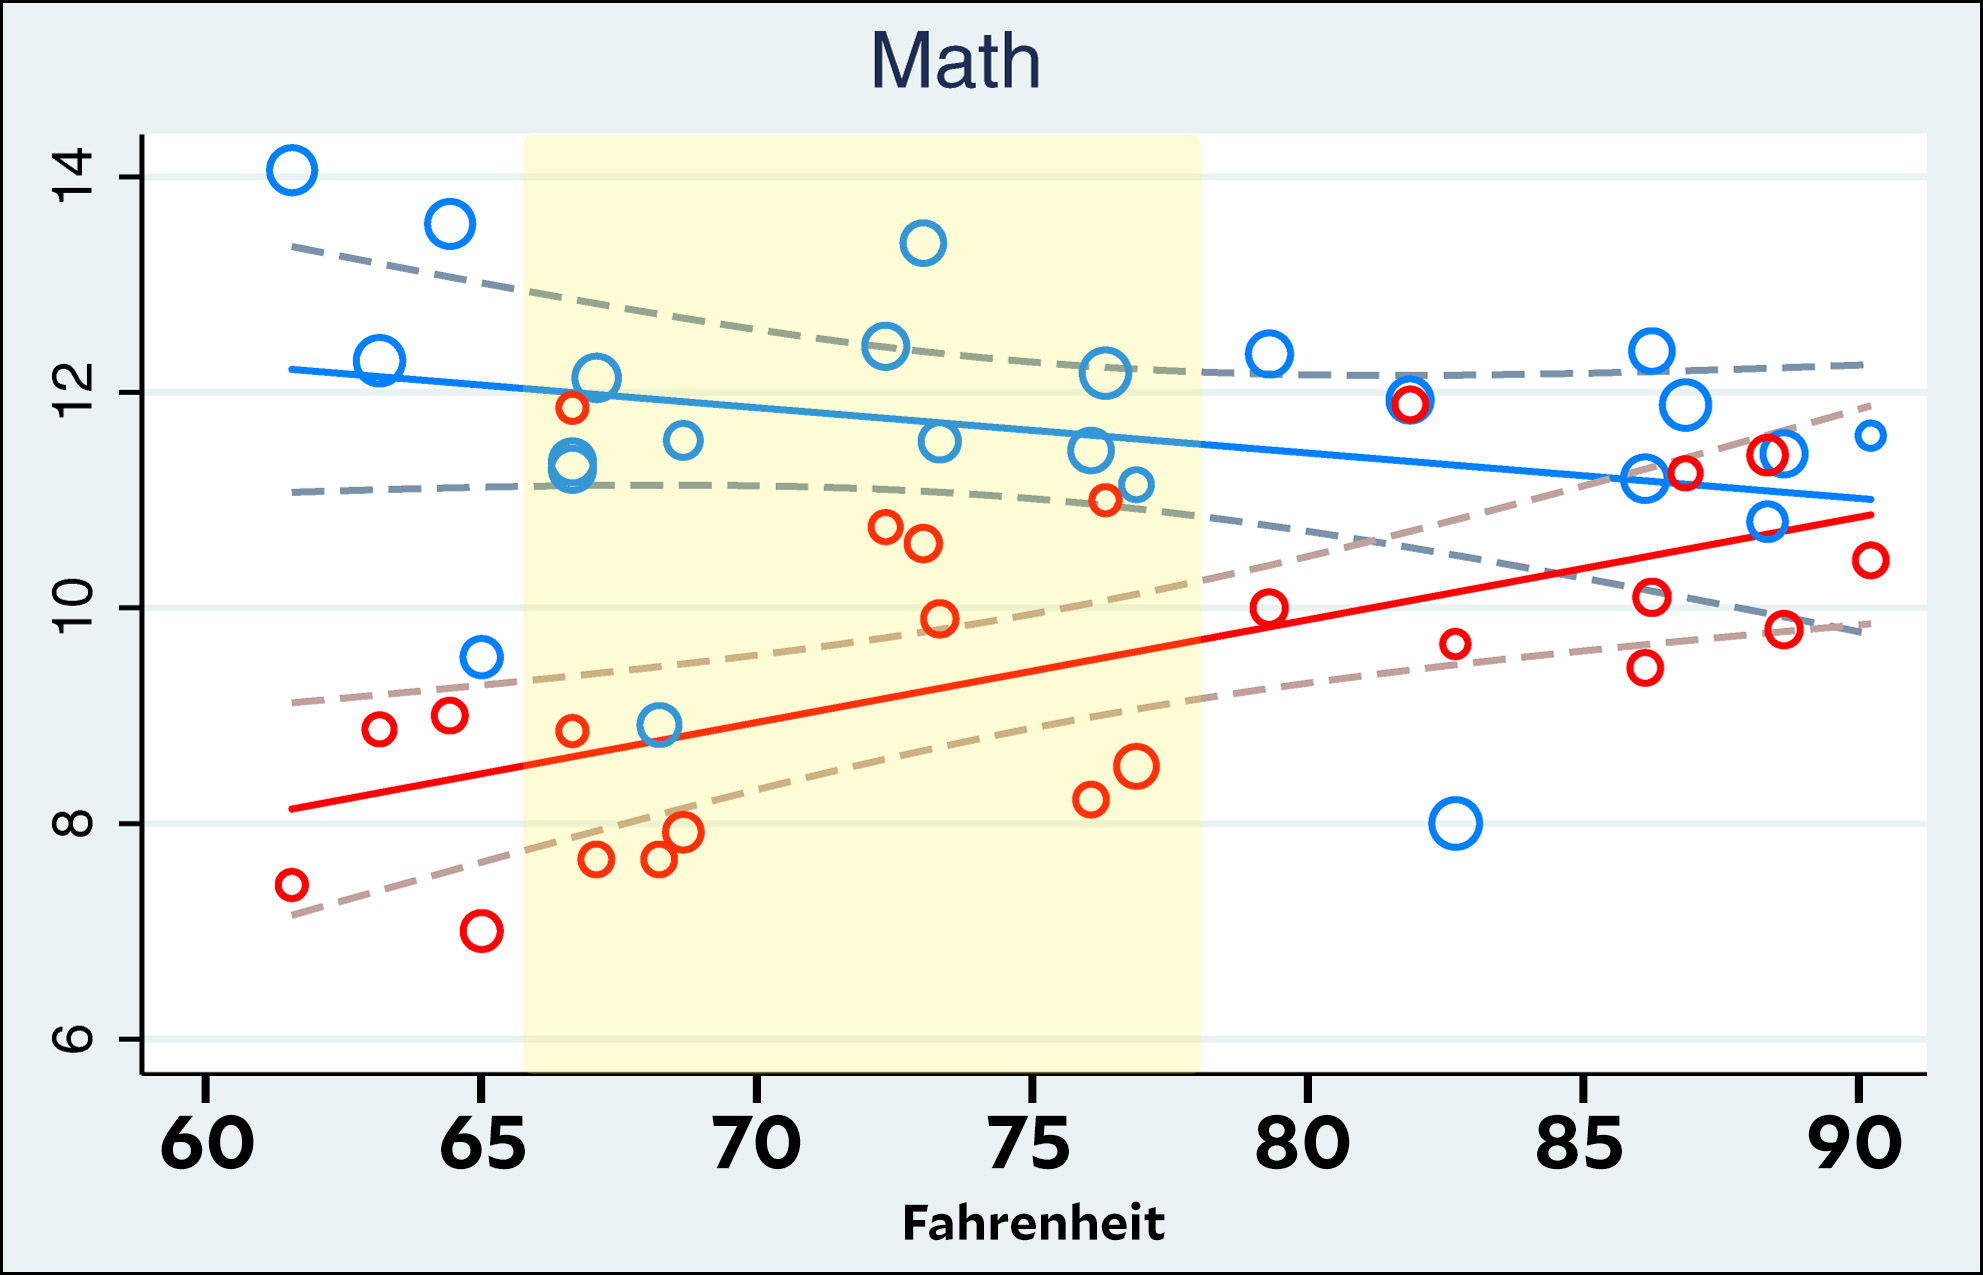
As you can see, in the math test men did a little worse as the temperature rose but women did way better. There were similar results in a verbal test. So the war of the thermostat is over: science has proven that we should turn the heat up. Hooray!
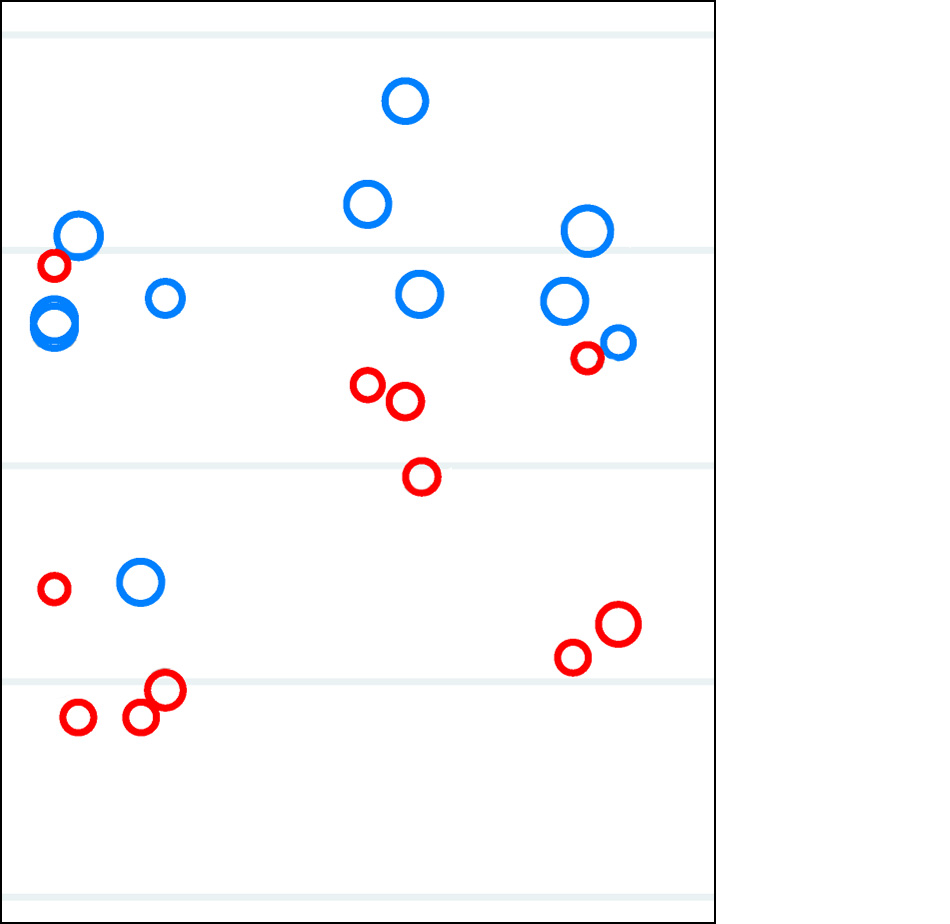
This is sort of an irresistible piece to write, but I’d like to point something out. I converted the original chart to Fahrenheit for my (mostly) American audience, and then I put a yellow box around the temperatures you’re actually likely to see in an office: around 66° to 78°. The rest of the chart is mostly nonsense, since this study is aimed at office workers and very few offices keep the temperature outside that range. Here’s what just that piece of the chart looks like, with all the trendlines removed:
If you run regression lines through the blue and red circles you’ll certainly get something, but it sure looks to me like it would be meaningless. The trend in the bigger chart seems to be driven almost entirely by the temperature extremes, which hardly anyone encounters in real life.
So as irresistible as it is, this study should probably be ignored. Maybe if they redo it with more samples restricted to reasonable ranges it would tell us something. Right now it doesn’t
POSTSCRIPT: I would like to declare my lack of personal bias in this matter by mentioning that I work at home and the thermostat isn’t an issue. Then again, when I worked in an office I never cared much about it either.
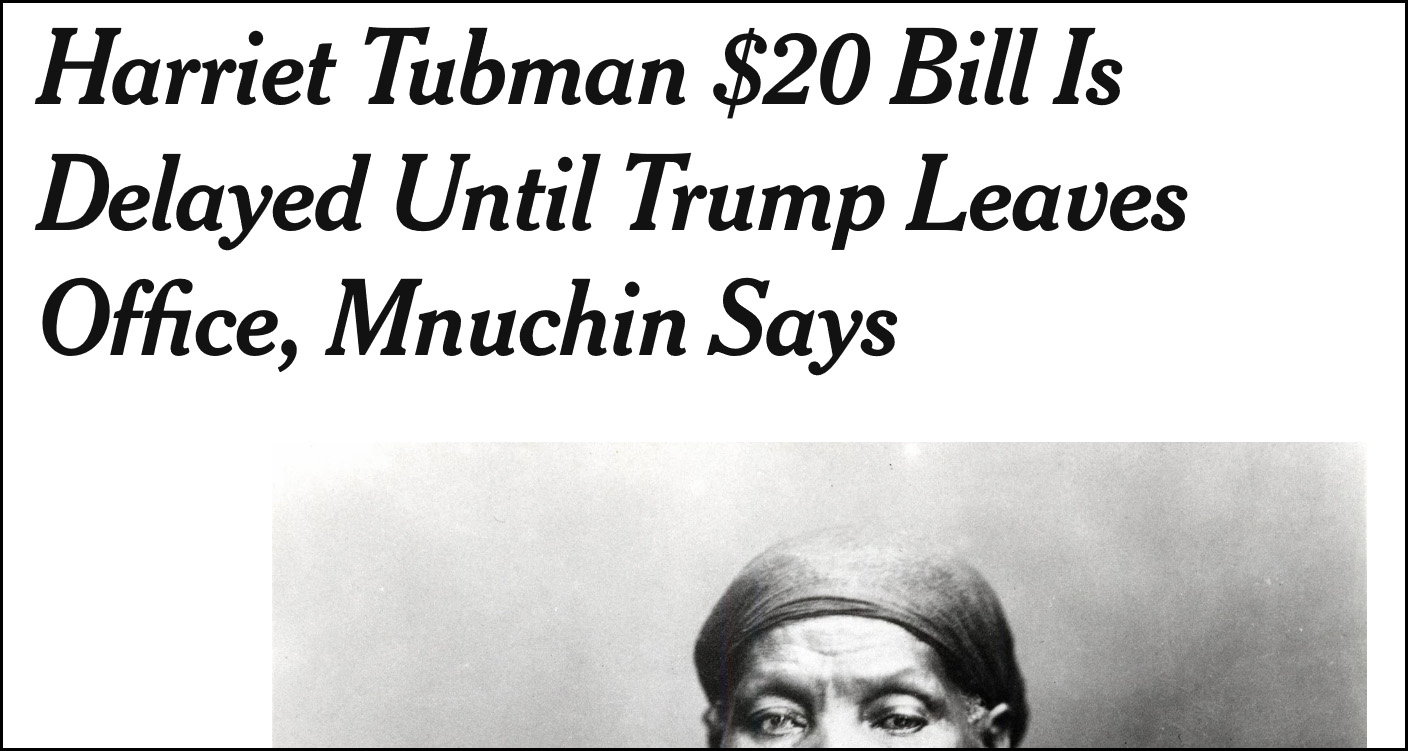
When I first saw this headline in the New York Times, I thought maybe the copy desk was taking some liberties:
But no. The story literally says the redesign was put on hold for fear of pissing off Donald Trump:
Harriet Tubman — former slave, abolitionist, “conductor” on the Underground Railroad — will not become the face of the $20 bill until after President Trump leaves office, Treasury Secretary Steven Mnuchin said Wednesday….Mr. Mnuchin, concerned that the president might create an uproar by canceling the new bill altogether, was eager to delay its redesign until Mr. Trump was out of office, some senior Treasury Department officials have said. As a presidential candidate in 2016, Mr. Trump criticized the Obama administration’s plans for the bill.
I was fiddling around with some numbers about homelessness in Los Angeles and came up with this. Note that the housing index has been adjusted for inflation:
There are reasons to be cautious about interpreting this. The homeless numbers are from HUD’s Point-In-Time program, which is known to be of mediocre accuracy. Even worse, there’s also some evidence that its methodology has changed over the years, which makes annual comparisons a problem. On the housing side, the Case-Shiller index is the average for houses. It doesn’t necessarily say much about either the availability or price of cheap rental stock.
All that said, it’s a pretty remarkable correlation, isn’t it? So I decided to try a few other cities:
None of them fit as nicely as the Los Angeles chart, but they definitely suggest a correlation between housing prices and homelessness. I assume this is no surprise to anyone, but it’s kind of interesting to see it set out like this.
A federal judge on Wednesday rejected President Trump’s request to block his longtime lender, Deutsche Bank, from complying with congressional subpoenas. Judge Edgardo Ramos of United States District Court in Manhattan issued his ruling after hearing arguments from lawyers for Mr. Trump and his family, as well as two Democratic-controlled congressional committees. “I will not enjoin enforcement of the subpoenas,” Mr. Ramos said, and added that he thought it was unlikely Mr. Trump and his family would win in a trial.
Oh come on. This guy is obviously Hispanic, so he probably hates Trump because Trump is so strong on the wall. Besides—
Wait. He’s from Puerto Rico? Well, then he probably hates Trump because of the way Trump stiffed Puerto Rico after Hurricane Maria. I mean—
Wait. You’re right. Trump has been responsible for giving Puerto Rico more disaster aid than any president in history. So, um, it must be—
HE’S A RADICAL LEFTIST OBAMA HACK. Yeah, that’s it.
These delightful little yellow spheres are actually a weed called stinknet. I never got close enough to see if they deserved their name, but my wildflower book assures me they do. I found them on the grounds of the old El Toro Marine Corps base, which is now being converted into a gigantic park.
I got a couple of interesting responses to my post yesterday suggesting that China is not a big threat. First this from reader DT, who objects to thinking of China as a single country with a fairly low per-capita GDP:
The issue here is that China is essentially two separate countries: (1) a bunch of really rich cities (population 200M+), and (2) an extremely poor rest of the country. Think of it as Mexico and the US under a single government. Unlike a normal country, authoritarianism and the hukou system keep the two more or less separate.
Per-capita GDP figures completely miss this reality. And it is important because China could become a serious competitor to the US if it had a very rich part of 300M (about the same size as we are) and a dirt-poor remainder of 1 billion people….You might think “oh, well those billion poor people are going to be a drag on the system.” But the bizarre reality of contemporary China is that they might not be. Who knows, the system might sustain itself indefinitely.
And this from reader RC:
I agree with what you said in your piece today, but I think you miss the key point. Yes, the US economy has a dominant lead over China’s, and Chinese internal policy is somewhat self-limiting. But the fight with Huawei (and others) isn’t about that at all. It’s broadly accepted that they are hard-coding access in their telecom equipment and burying various hidden functions in their silicon. The use of this hardware opens up a door to cyber espionage and sabotage that is orders of magnitude worse than the alternatives.
They’re still going to place these chips and switches in Western nations, but to the extent that we can keep that kind of compromised gear out of our networks we probably should.
I don’t know enough about China to have a considered opinion about these points, but I’ll toss out a couple of comments. On the GDP issue, this strikes me as a bit like saying the US is a country of 50 million with a per-capita GDP of $100,000, plus a bunch of poor people no one cares about. But you can say this about every country. Is it legit to make this comparison? Or is it legit only for China because their rich bit is so big in absolute terms?
As for Huawei, I agree that it’s “broadly accepted” that their equipment is compromised. But is it true? It’s not that I’d be surprised or anything, but I guess I’m a little more skeptical of accepting stuff like this on faith than I used to be.
Back in 2001, John Donohue and Steven Levitt wrote a famous paper linking the decline of crime to the rise of abortion. Put in blunt terms, it made some intuitive sense: unwanted children are more likely to grow up in circumstances that lead them into criminal behavior, so aborting these unwanted children is likely to reduce the number of criminals 20 years later. The paper came in for a lot of criticism, including some serious coding errors that were swept away with a bit of statistical sleight of hand, but D&L did make a prediction:
Roughly half of the crimes committed in the United States are done by individuals born prior to the legalization of abortion. As these older cohorts age out of criminality and are replaced by younger offenders born after abortion became legal, we would predict that crime rates will continue to fall. When a steady state is reached roughly twenty years from now, the impact of abortion will be roughly twice as great as the impact felt so far. Our results suggest that all else equal, legalized abortion will account for persistent declines of 1 percent a year in crime over the next two decades.
Now they’re back to check out this prediction, and they say that not only were they right, but the impact of abortion on crime was even higher than they initially thought. Now, it’s no secret that I think D&L are wrong: the important thing that happened in the 70s was the reduction of lead in gasoline, which by coincidence happened at around the same time as the increase in abortion. That said, if they’re still serious about the abortion-crime hypothesis, I have a question and a suggestion. First off, here’s a chart showing abortion rates, crime rates, and a stylized version of expected crime rates based on abortion rates:
Don’t take the precise levels of the “Expected Crime” line seriously. It’s just a mirror image of the abortion rate (the dotted gray line) and shows the rough shape you’d expect if abortion rates affect crime with a lag of about 20 years. What you’d expect is:
A long period of high crime when abortion rates were low.
A short period of falling crime as abortion rates rise.
A long period of slowly rising crime as abortion rates decline.
The only one of these that checks out is the middle one. In the pre-Roe era, crime wasn’t steadily high. It was steadily low and then began rising in the mid-60s. And in the 2000-present era, crime hasn’t slowly risen, it’s just kept on declining.
It’s true that D&L predicted that when a “steady state” was reached, crime would continue to fall. But we haven’t reached a steady state. The abortion rate has steadily fallen ever since its peak in 1980. This should predict a slow rise in crime, but in fact crime has continued to decline.
So that’s my question: how well do the abortion and crime data really match up? And here’s my suggestion: one thing I’ve learned from my lead-crime research is that a single national-level correlation just isn’t enough to prove anything. The first paper showing a national lead-crime correlation was published in 1999, and the first paper looking at state-level differences (a strategy also used by D&L) was published in 2007. But it wasn’t until 2012 that I wrote about it. Why? Because those papers were intriguing but not conclusive. Much more evidence was needed, and it wasn’t worth a story until that evidence began to accumulate.
Here’s one way of accumulating more evidence: check out the abortion-crime correlation in other countries. The crime decline, after all, has been worldwide (though not identical in all countries). Here are four interesting countries to look at:
These are interesting because they aren’t similar to the US experience:
Slovakia had a high abortion rate all through the 60s, with a peak in the 80s and then a decline.
Australia had a sudden increase in abortion in the mid-80s.
Poland had a high abortion rate that fell steadily for three decades before effectively reaching zero.
Portugal had a low abortion rate that increased suddenly around 2005.
I don’t know how accurate these abortion figures are. That would require some serious research. But if you do this research, and then match up abortion rates with violent crime rates, you could find out if the abortion-crime hypothesis seems to pan out in different countries. It wouldn’t be a silver bullet, and nobody should expect perfect correlations, but we should expect to see rough shapes that match the hypothesis.
If D&L (or anyone else) are serious about the abortion-crime hypothesis, this is the kind of thing they need to do. Their theory really doesn’t deserve anyone’s serious attention until there’s more than just a modest correlation in a single country.
"So I told him, 'Don't you dare slam that door, Don,' and he just slunk out without a peep. Funniest thing I ever saw."Douglas Christian/ZUMA
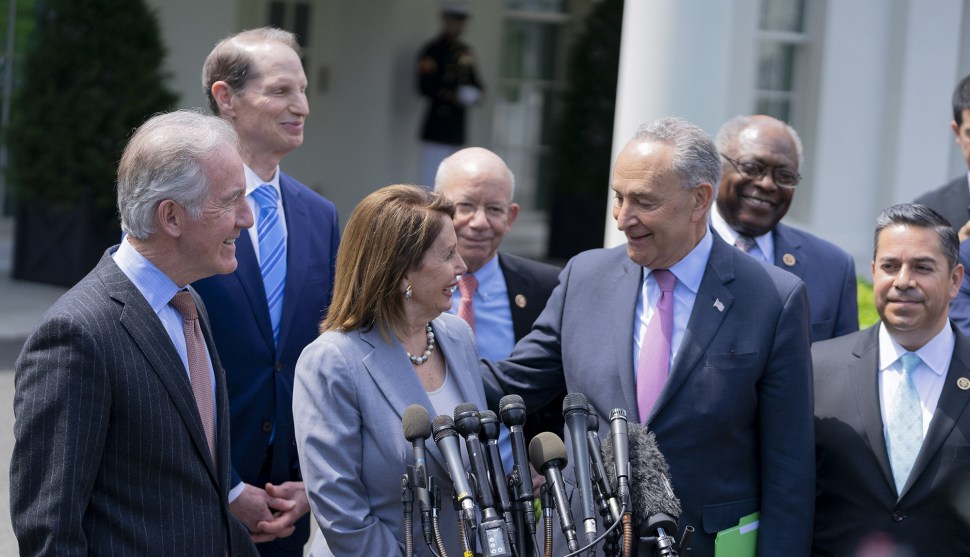
Donald Trump’s trillion-dollar infrastructure bill was obviously DOA from the moment he first announced it. His own party made it clear that they had no intention of spending a bunch of money on infrastructure, and it would have been a debacle if he’d sent an actual plan to Congress. On the other hand, he had promised infrastructure and Democrats were playing along. What to do?
President Trump abruptly ended a meeting with Democratic leaders on Wednesday, saying he was unable to work with them on legislation following comments by House Speaker Nancy Pelosi (D-Calif.) that he was “engaged in a coverup.” Trump made an unscheduled appearance in the Rose Garden shortly afterward and in a meandering 10-minute address said he had left the meeting with Pelosi and Senate Minority Leader Charles E. Schumer (D-N.Y.) at which they were supposed to talk about working together on a $2 billion infrastructure plan. “Instead of walking in happily to a meeting, I walk in to look at people who said I was doing a coverup,” Trump said, adding that he can’t work on infrastructure “under these circumstances.”
….Speaking to reporters shortly after Trump’s appearance in the Rose Garden, Pelosi and Schumer said they were taken aback by Trump’s behavior. “To watch what happened in the White House would make your jaw drop,” Schumer said.
Speaking for myself, I no longer have much of a jaw to drop after two years of watching Trump. In any case, this is obviously just a way to extricate himself from a bad situation and get in a little bit of victimization playacting while he’s at it. It deserves no attention.
UPDATE: I missed this from earlier in the day from Politico:
The White House is not going to present any plan to pay for rebuilding the nation’s roads and highways. Instead, the administration will ask Democrats to make the case for a $2 trillion package. The White House has identified roughly $1 trillion in spending cuts to pay for legislation — about as realistic a plan as saying this newsletter will fly you to the moon if you say abracadabra.
President Trump effectively blew up negotiations with Democratic leaders over a plan to rebuild the nation’s highways, airports and other infrastructure on Tuesday night, insisting that they put the idea aside until Congress approves a new trade pact with Mexico and Canada.
So now we have three different excuses for ditching the infrastructure plan: Democrats are mean; Democrats need to figure out how to pay for it; and Democrats need to pass the trade deal first. Needless to say, all of these are made up from whole cloth. The real reason is that Republicans have no interest in paying for Trump’s plan, but he didn’t bother checking with them first before he proposed it.
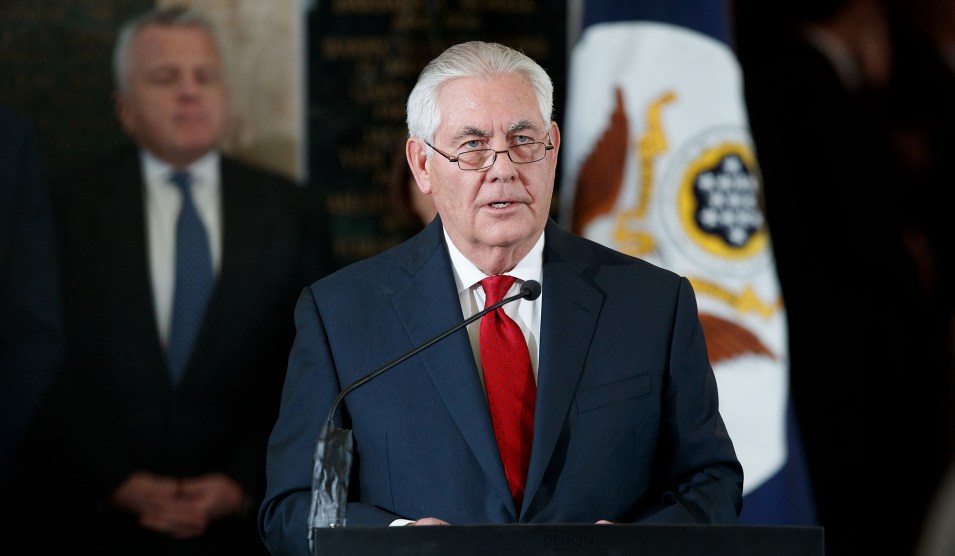
Former Secretary of State met with leaders of the House Foreign Affairs committee on Tuesday. The Daily Beast reports:
Tillerson reached out to the committee and expressed a willingness to meet, a committee aide said. In a more than six-hour meeting, he told members and staffers that the Trump administration actively avoided confronting Russia about allegations of interference in the election in an effort to develop a solid relationship with the Kremlin, a committee aide told The Daily Beast.
Not a big surprise, I guess, but it’s always nice to have insider confirmation. I suspect, however, that a desire to develop a “solid relationship with the Kremlin” wasn’t the only reason Trump didn’t confront Putin about this. He also wanted to make it clear that further interference in 2020 would be just peachy.
Somebody asked recently about the homeownership rate among millennials. I’ve posted about this before, but the chart had too little detail to really see what’s going on. So here it is:
You might be surprised that the homeownership rate among young familes is nearly the same as it was in 1994. But you shouldn’t be. It’s true that home prices have gone up a lot in the past couple of decades, but remember two things: (a) prices have truly skyrocketed only in a small handful of hot cities, and (b) mortgage interest rates have declined a lot. Back in 1994 your 30-year loan came with an interest rate of over 9 percent. Today it’s a bit over 4 percent.
When you take mortgage rates into account and look at monthly payments as a percent of income, prices have been steadier than most people think. Here it is nationally:
The average monthly home payment has stayed remarkably stable since 1994. Here are average monthly payments for three big cities:
In order to calculate monthly payments as a share of income, I used income figures that are averages for the whole country since that’s all I’ve got. However, it’s worth noting that average incomes are higher in big cities, so the percentage of income it takes to buy a home is actually significantly less than these charts show. But the important thing isn’t really the absolute percentage anyway, it’s the change over time, and these charts show the change accurately.
Bottom line: Average monthly payments are up about a third in Los Angeles, but down a bit in New York and down a lot in Atlanta. With the exception of a few super-hot cities like San Francisco and Seattle, young buyers today face about the same cost to buy a home as young buyers of 25 years ago. So it’s not that big a surprise that homeownership rates among millennials aren’t really very different than they were among Gen Xers in the 90s.
POSTSCRIPT: Home prices are based on HUD data for the national series and on Case-Shiller indexes for the three city series. I assume a 10 percent down payment. Mortgage rates are from Freddie Mac. Median household income for 25-34 year-olds is from the Census Bureau.
And we respect that! But maybe you’re of a mind to support our work directly instead? We have until December 31 to raise the last $400,000 we need to keep our nonprofit newsroom running at full strength into 2026. Will you make a gift today?
We noticed you have an ad blocker on. Can you pitch in a few bucks to help fund Mother Jones' investigative journalism?
Billionaires own the media,
but they don’t own us.
At Mother Jones we know these aren’t conventional times, and they require unconventional coverage. That’s what deliver every day: fierce, independent journalism you can’t find elsewhere. Perhaps never in the history of our country has that been more necessary than now. But we can’t do it without reader support—your support. Please chip in today.