Tom Williams/Congressional Quarterly/Newscom via ZUMA
Here’s a headline in the Washington Postthis morning:
Republican National Committee has huge financial edge heading into 2018 midterms
I had a point I thought I wanted to make about this, but then I clicked the link and read the story:
The RNC, the GOP House and Senate party committees and the two main Republican congressional super PACs together raised nearly $289 million in 2017.
….The Democratic National Committee trailed far behind its Republican counterpart, raising $64.5 million in 2017. But the Democratic Senatorial Campaign Committee and the Democratic Congressional Campaign Committee last year both outraised their respective GOP counterparts, the National Republican Senate Committee and the National Republican Congressional Committee. In total, the three Democratic Party committees and two main Democratic congressional super PACs raised about $258 million in 2017, filings show.
The Republican groups have raised 12 percent more than the Democratic groups. That’s a huge financial edge?
Now, it’s true that the RNC alone has massively outraised the DNC alone. So I suppose I’ll go ahead and make my point anyway: I assume that a big reason for this is that the DNC has faced a sustained backlash from the Democratic Party base, which simply doesn’t trust the DNC to support progressive candidates. Maybe this is fair, maybe it’s not. It’s not an area of politics that I follow very closely. But the bottom line is that this money hasn’t just disappeared. Instead of donating to the DNC, a lot of Democratic donors are giving their money either directly to candidates or to other progressive groups.
There’s probably an interesting story to be written about that, but it would take some work. I’d be a lot more interested in reading it, though.
A few weeks ago I promised an updated roundup of evidence about the link between lead poisoning and violent crime. Here it is.
It’s in three parts. Part 1 is the basic story. Part 2 is various bits of commentary explaining different details and predictions of the hypothesis. Part 3 is a roundup of all the lead-crime studies that have been done since 2012 that I’m aware of.
1. A Brief Summary of Lead and Crime
The lead-crime hypothesis is pretty simple: lead poisoning degrades the development of childhood brains in ways that increase aggression, reduce impulse control, and impair the executive functions that allow people to understand the consequences of their actions. Because of this, infants who are exposed to high levels of lead are more likely to commit violent crimes later in life. There are three types of research that confirm the connection between lead and crime:
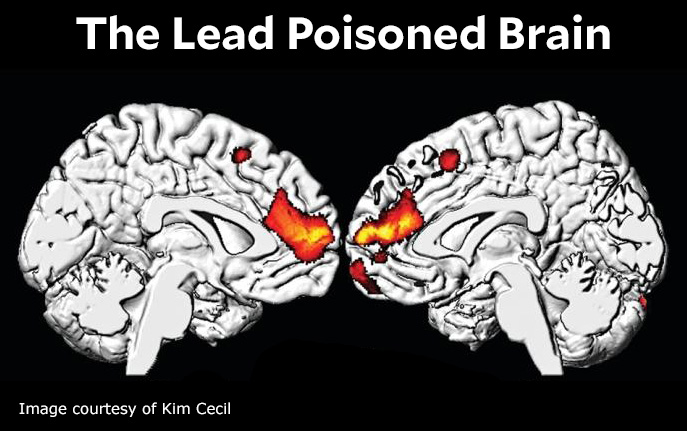
Brain studies. Neurologists have performed MRI scans of adults who were exposed to lead as children. They’ve found that because lead is chemically similar to calcium, it displaces the calcium needed for normal brain development.
Prospective studies. These are studies that begin in childhood and follow a group of children through adulthood. The children are measured along the way and their adult outcomes are catalogued. Several prospective studies have shown that children who are exposed to high levels of lead are more likely to be arrested and incarcerated for violent crimes later in life.
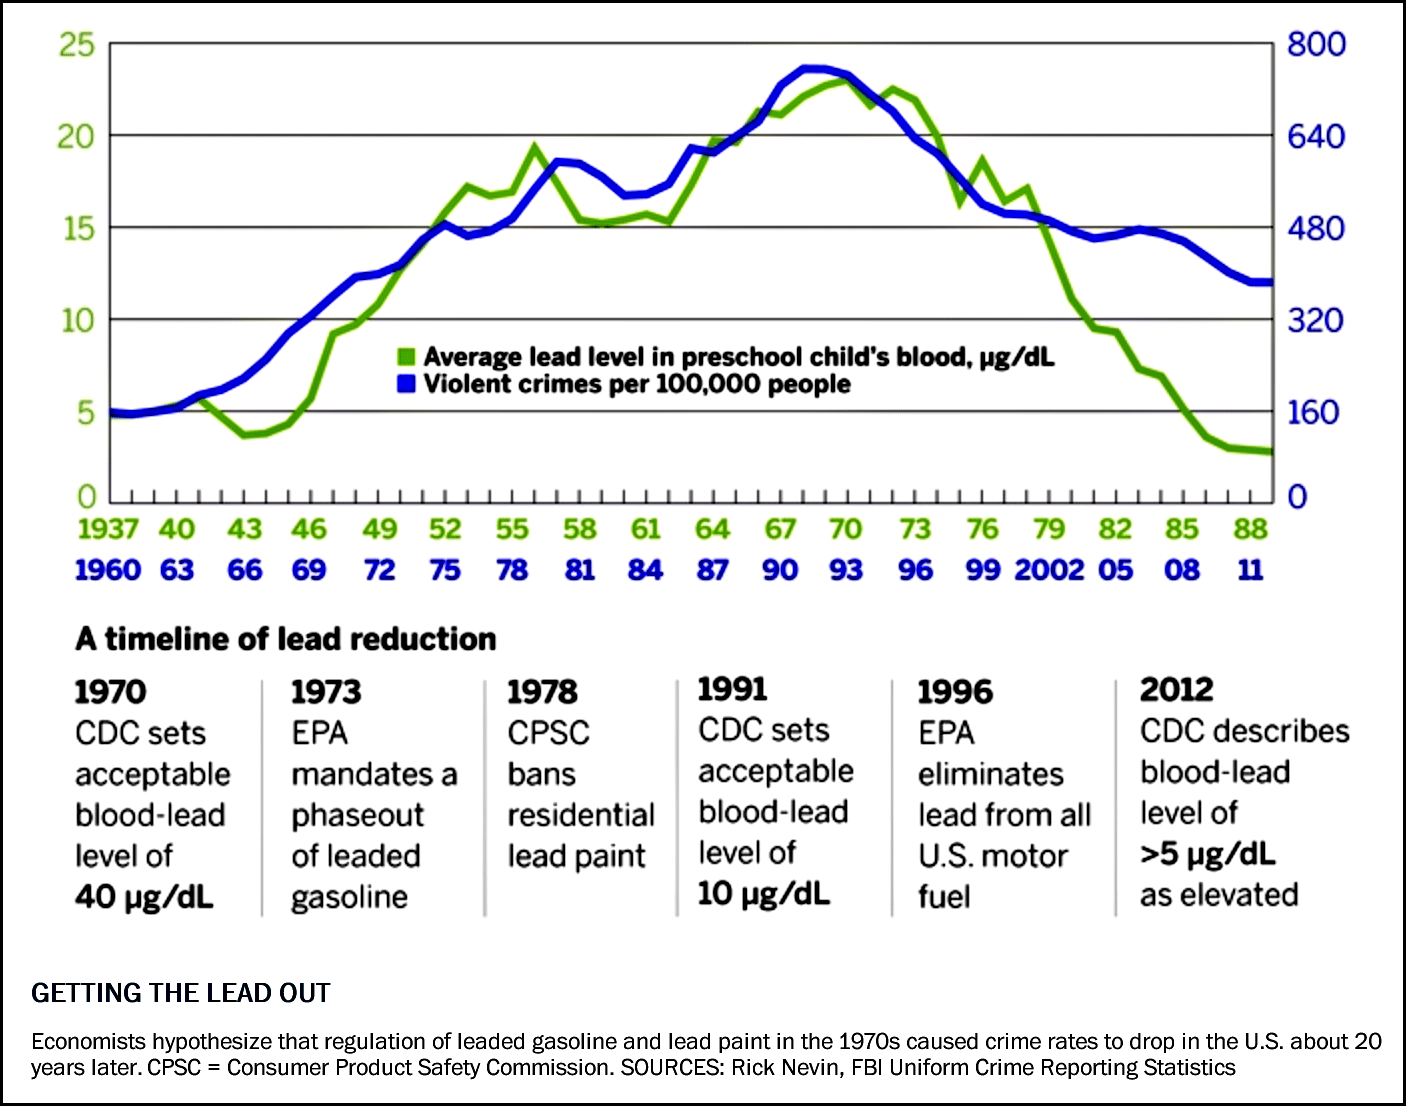
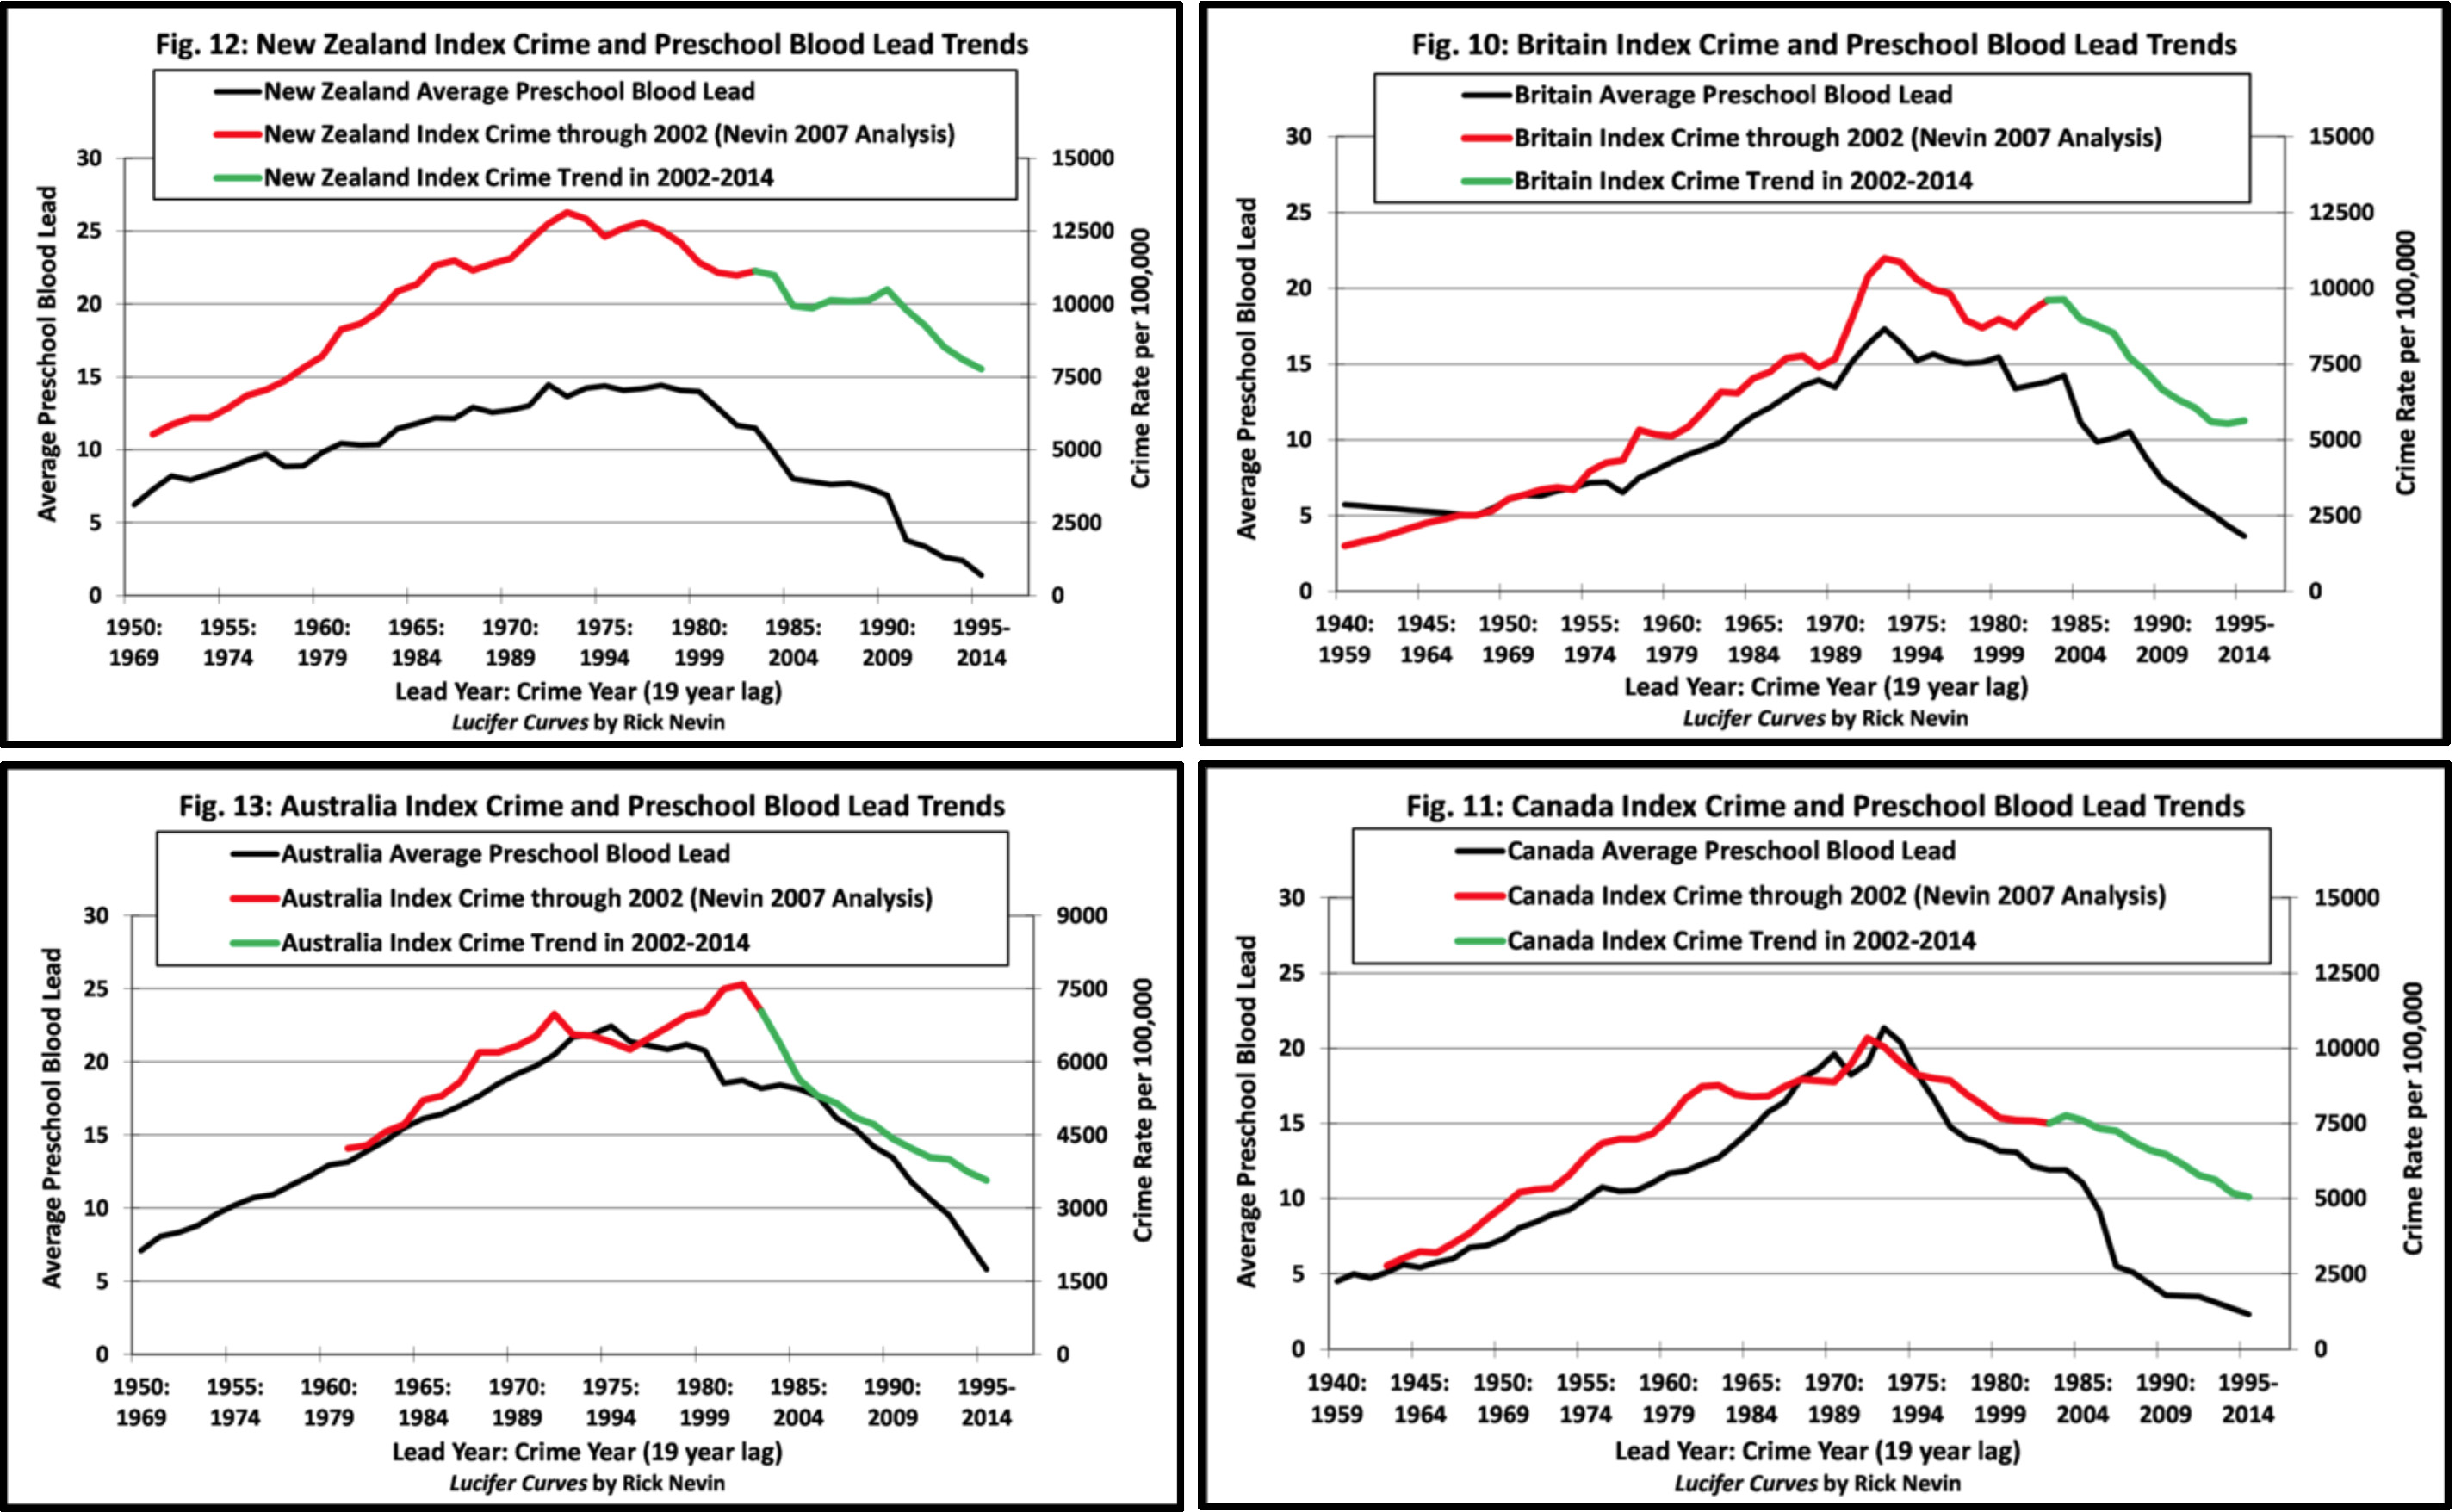
Population studies. These are studies that depend on statistical analysis of groups, rather than individuals. Dozens of population studies have found strong correlations between the exposure of a group to lead and the level of violent crime committed by the group later in life. These groups can be neighborhoods, cities, states, or countries. For the USA, the correlation between lead and crime looks like this:
No single study is proof of the lead-crime hypothesis. However, the accumulated evidence for the hypothesis is pretty overwhelming. I outlined the case for the lead-crime hypothesis in 2012 in a magazine piece called: Lead: America’s Real Criminal Element.
In a nutshell, this article argues that atmospheric lead from gasoline tailpipes rose steadily after World War II, affecting babies born in the late 40s and beyond. The leading edge of this generation became teenagers in the late 60s and was more prone than previous generations to committing violent crime. Every year the population of teenagers with lead poisoning increased, and violent crime increased with it. This is why the 70s and 80s were eras in which crime skyrocketed.
In the early 70s the United States began to phase out leaded gasoline and newborns became steadily less lead poisoned. Like clockwork, as the leading edge of this generation became teenagers in the early 90s, the crime wave started to recede. By 2010, an entire generation of teenagers and young adults—the age group responsible for most crime—had grown up nearly lead free, and the violent crime rate had plummeted to half or less of its high point. This happened across the board: in big and small cities; among blacks and whites; in every state; in every city; and, as it turns out, in every other country that also phased out leaded gasoline.
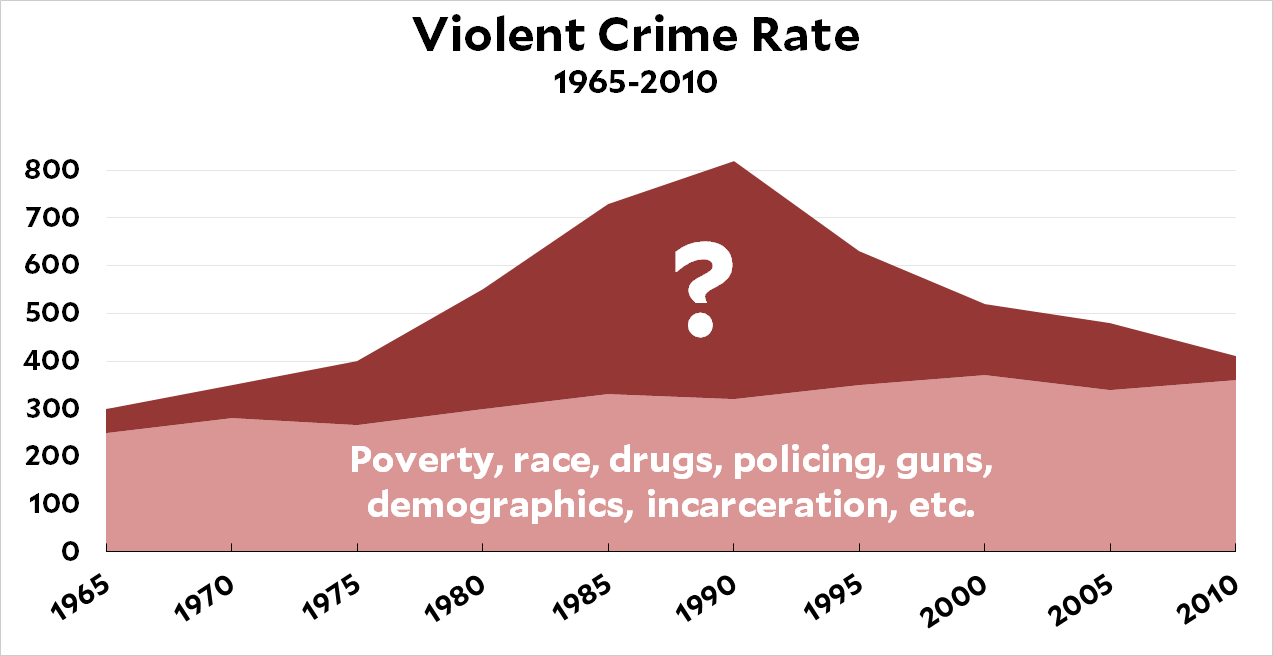
It’s important to emphasize that the lead-crime hypothesis doesn’t claim that lead is solely responsible for crime. It primarily explains only one thing: the huge rise in crime of the 70s and 80s and the equally huge—and completely unexpected—decline in crime of the 90s and aughts. The lead-crime hypothesis is the answer to the question mark in the stylized chart below:
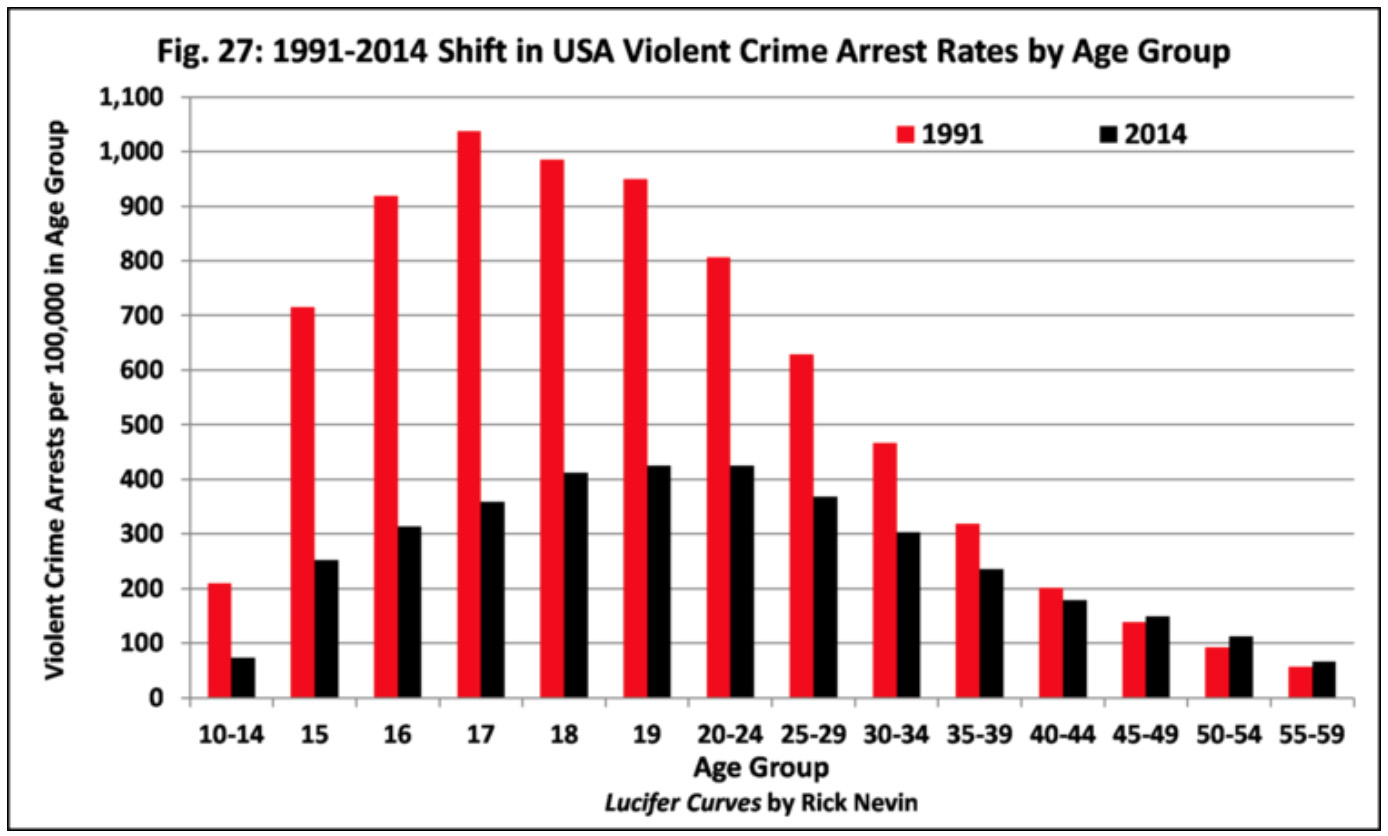
Since I wrote my article in 2012, researchers have conducted nearly a dozen new studies designed to test the lead-crime hypothesis. All but one of them has supported it, and the single outlier has some serious methodological issues. The only real challenge remaining is from criminologists who examine, say, murder rates in the 80s and find that all age cohorts between 15 and 30 were equally violent. But if lead levels increased over time and therefore affected different age groups differently, shouldn’t we see differences in crime rates by age group too? Does this disprove the lead-crime hypothesis?
The biggest problem here is that no agency tracks crimes by the age of the perpetrator. The data just doesn’t exist. However, we can estimate it for murder because it’s well-known that murderers and their victims tend to be of similar ages. Unfortunately, the number of murders is relatively small compared to the universe of violent crime, which makes it statistically challenging to analyze. What’s more, the 80s are a decade in which virtually every age cohort from 15 to 30 was pretty severely lead poisoned.
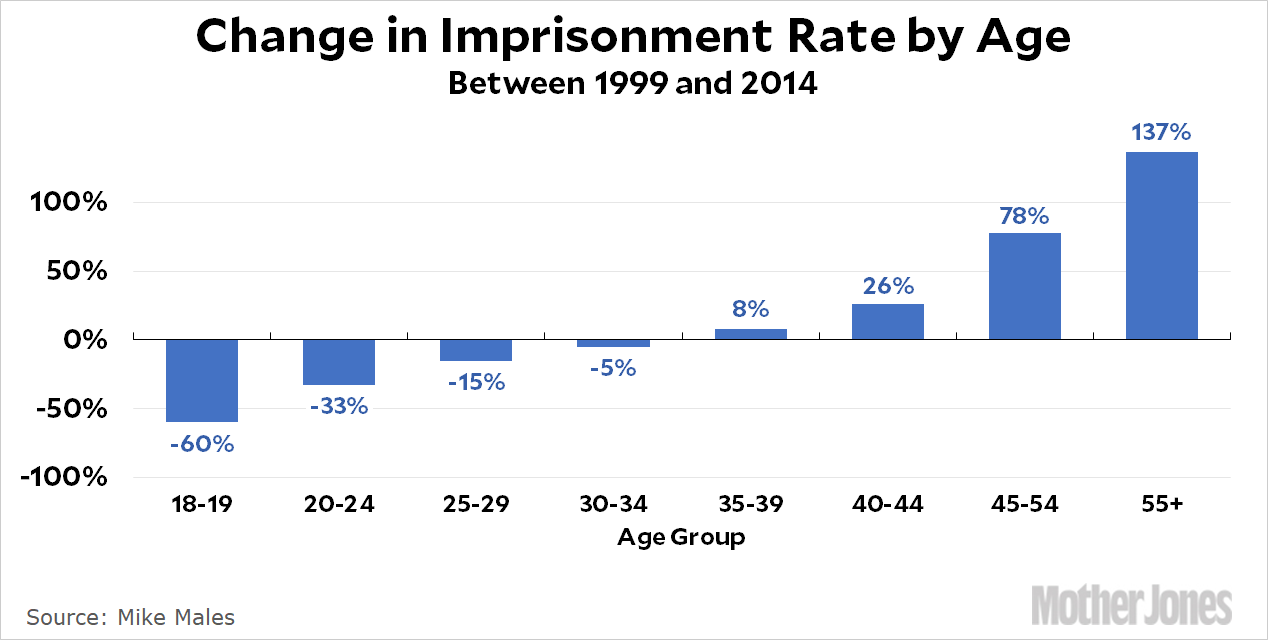
For this reason, cohort analysis based on murder rates in the 80s is unlikely to have the statistical power to tell us much. And since age data for other crimes and other eras doesn’t exist, we’ll never get anything better. However, in recent years we’ve gotten some new evidence: once crime began to decline, it was only a matter of time until incarceration began to decline too. That’s started to happen over the past decade, and of course we know the precise age of everyone in prison. What we’ve found is that incarceration rates are dropping almost precisely the way the lead hypothesis predicts: big drops for younger cohorts who are lead free these days, and smaller drops for older cohorts who are still part of Generation Lead. It appears that, in fact, violent crime almost certainly rose and fell by age cohort, just as it should have. There’s more on this below.
In my opinion, the lead-crime hypothesis is by now all but unassailable. The amount of direct research supporting it is massive, and there have even been a few studies done of lead in completely different contexts (lead paint, lead in water pipes) that support the hypothesis in different eras. What’s more, given what we know about how lead affects the brain, none of this should be surprising. What would be surprising is if a powerful neurotoxin like lead didn’t affect violent crime.
2. Commentary on Lead and Crime
The prison population is dropping. Declining exposure to lead starting in the mid-70s reduced the rate of violent crime 20 years later. Twenty years after that, as members of Generation Lead are being released from prison and aren’t being replaced, the prison population has finally started to drop too. The decline is most pronounced among younger cohorts, just as you’d expect from the lead-crime hypothesis.
Lead and murder. We have fairly good data on homicide rates going back for a century, and it turns out the United States has had two epidemics of murder, the first in the 20s and 30s and the second in the 70s and 80s. When you account for both lead paint and gasoline lead, it turns out that lead can explain them both.
Black juveniles. Since 1991, violent crime rates have declined across the board. However, the arrest rate for black juveniles has dropped more sharply than the rate for white juveniles. Why? Because blacks were more affected by lead in the 60s and 70s. Their crime rate went up more than it did for whites, so when lead was removed from gasoline their crime rate went down more than it did for whites. See also here, which looks at incarceration rates for blacks and whites. And also here.
Cop killers. Police killings by young people have dropped staggeringly since 1990. Among the cohort aged 18-24, the rate of police killings has gone down from 33 per year to 4 per year.
Jamaica, man. The country of Jamaica phased out leaded gasoline between 1990 and 2000. Twenty years later, just as you’d expect, the murder rate began a steep decline. (Homicide in Jamaica has stayed generally lower since then, but has spiked up and down in recent years. That’s because although lead is associated with crime, there are lots of other reasons for crime to go up and down too.)
Lead and terrorism. Based on when they banned leaded gasoline, I predict that Middle East terrorism will begin a long decline starting around 2020 or so.
International crime trends. Violent crime began to drop in the United States in the early 90s, about 20 years after we began reducing the lead content of gasoline. But how about other countries? Where can we expect to see crime drops in the future?
George Monbiot and Scott Firestone. Monbiot endorses the lead-crime theory and Firestone criticizes it. I respond, along with a brief summary of the multiple threads of research that support the lead-crime hypothesis. Followup here.
Baselines vs. crime waves. Lots of things contribute to baseline levels of crime. But lead is uniquely able to explain why there was such a huge rise of crime above the baseline during the 60s, 70s, and 80s, followed by an equally huge reduction back to the baseline in the 90s and aughts.
Crime in Japan. Leaded gasoline in Japan was banned completely in 1980. By 2000 the country had an entire cohort of teenagers who had grown up lead free. The lead exposure of Japanese children is now among the lowest in the world, and as a result the Economist reports that crime is so low that police officers are getting bored.
Big cities vs. small cities. Surprisingly, it turns out that once you reduce exposure to gasoline lead, big cities aren’t really all that much more dangerous than small ones after all.
A response to Jim Manzi. This is a wonky post responding to Manzi’s generic critique of econometric analysis of complex social issues.
High school fights. If high lead levels dispose some people to lives of violent crime later in life, it should dispose even more people to lives of moderately higher violent behavior. We don’t have data for schoolyard fights in the 60s and 70s, but we do have data since 1992, and they’ve been declining the whole time, just as the lead-crime hypothesis predicts.
Crime and race. In the postwar era, black children were exposed to much more lead than white children. This explains some of the racial differences in both crime rates and incarceration rates.
Red Barns and Rural Crime. In the 19th century, most American farmers painted their barns red. However, around 1880 better quality white lead paint became cheaply available thanks to railroad expansion and ready-mixed paint available from Sears Roebuck and others. About 20 years later, rural homicides increased dramatically, nearly catching up to murder rates in cities—which, of course, had been using lead paint for decades.
Bill de Blasio. In 2013, I predicted that crime in New York would continue to stay low no matter what Bill de Blasio did as mayor. Why? Because crime declined due to reductions in lead, not because of CompStat or stop-and-frisk or anything that Rudy Giuliani or Mike Bloomberg did. It’s now 2018. I was right.
Cohorts and crime. The arrest rate of young people is down substantially since 1991. This is because young people today grew up with far less lead poisoning than young people a couple of decades ago. But what about older folks? They grew up with a bit more lead poisoning than people who were middle-aged in 1991. And guess what? Their arrest rate is a little higher than the same age cohort in 1991.
More cohorts. Mike Males looks at incarceration rates by age and finds a perfect correlation. Incarceration is down substantially for the youngest cohorts; about the same for middle cohorts; and up for older cohorts. Incarceration rates are down a stunning 60 percent among 18-19 year olds, which is consistent with the lead-crime hypothesis. Young cohorts these days are pretty lead free and far less violent than in the past. Older cohorts, by contrast, are still part of Generation Lead, and they’re committing more crimes compared to older cohorts from the 1990s, who mostly grew up before the lead era. See also here. And here.
Ethanol and São Paulo. In 1975, after the first Arab oil embargo, Brazil started a campaign to replace gasoline with ethanol. Most of the ethanol went to São Paulo, and by the mid-80s half the cars in the province had stopped using gasoline. Sure enough, 18 years later the murder rate started dropping dramatically. Today it’s at one-third the level of 2002, when the decline began.
Violent crime in Britain. The violent crime rate in Britain peaked in 2007 and then dropped sharply. This is consistent with Britain’s experience: They banned leaded gasoline in 1988, and then made the switch to unleaded very quickly.
Criminologists and lead. A criminologist provides a pitch perfect dismissal of the lead-crime hypothesis because, by God, crime is a sociological problem and that’s that.
The politics of lead. Everyone has their own pet theory of why crime rose in the 60s and 70s: guns, poverty, drugs, the counterculture, the breakdown of the family, black “pathologies,” racism, moral decay, the decline of religion, and so forth. This is why so many people dislike the lead-crime hypothesis. If it’s true, it means your pet theory probably isn’t. And nobody wants to give up their pet theories.
3. Studies of Lead and Crime Since 2012
2014, Reyes: A second study from Jessica Wolpaw Reyes, this time using data from the National Longitudinal Study of Youth. She finds that early childhood lead exposure leads to “an unfolding series of adverse behavioral outcomes: behavior problems as a child, pregnancy and aggression as a teen, and criminal behavior as a young adult.”
2013, Aharoni et al.: Brain scans show that prisoners with lower activity in the anterior cingular cortex (ACC) are twice as likely to return to crime after they’re released. This is consistent with the lead-crime hypothesis: the effect of childhood lead poisoning is permanent loss of tissue in the ACC, which controls emotional regulation, impulse control, attention, verbal reasoning, and mental flexibility.
2017, Aizer and Currie: The authors take advantage of an extremely detailed dataset of children in Rhode Island that allows them to track the effect of lead on individuals, rather than just averages on an entire population. For each child, they measure school suspensions and juvenile detentions along with two measures of lead poisoning: (a) childhood blood lead levels and (b) distance from major roadways, which are associated with a large concentration of lead fumes. In both cases, they find a substantial association of lead poisoning with future juvenile delinquency.
2014, Liu at al.: A prospective study of childhood lead-poisoning in the Jiangsu province of China. The study so far has followed the children only up to age six, but it has already found “significant associations between blood lead concentrations and increased scores for teacher-reported behavioral problems.”
2017, Billings and Schnepel: A very powerful study of two groups of North Carolina two-year-olds born in the 1990s. Both groups tested high for lead poisoning, but one was slightly above 10 μg/dl and one was slightly below. The high group received an intervention that substantially lowered their lead exposure. Later in life, the intervention group had far lower arrest rates for violent crimes.
2017, Grönqvist et al.: A study of lead in Sweden concludes that “early lead exposure may have deleterious effects on the academic performance among children with blood lead at least at levels from 3 μg/dL and above, and criminal behavior from 5 μg/dL.” The researchers also found the lead had strong negative effects on social maturity, emotional stability, and the ability to make and carry out plans. All of these are things related to violent crime.
2016, Feigenbaum and Muller: An entirely different approach to lead and crime. The authors compared cities in the early 20th century that installed lead water pipes vs. iron water pipes. This was a fairly random choice, usually based on whether a lead pipe factory was nearby and could offer a better price than iron pipes. Two decades later, the lead pipe cities had murder rates 14-36 percent higher than the iron pipe cities.
2014, Wolf: An article in Chemical and Engineering News that focuses on recent neuroscience studies showing what lead does to the brain and how this is associated with violent crime.
2016, Boutwell et al.: A team of researchers studied crime at the census tract level in St. Louis. They found “a relatively strong effect of lead on behavior, especially violent behavior.” Statistician Andrew Gelman confirmed that the analysis in the paper was all kosher.
2016, Lauritsen et al.: The authors compare lead poisoning to crime rates, but instead of using the FBI’s numbers for crime (reported by police departments), they used the NCVS survey of crime (as reported by interviews with families). They conclude that if you used the NCVS data the correlation between lead and crime is zero. However, there are some pretty strong reasons to suspect that something is wrong with this study.
2016, Taylor et al.: An Australian team used records of atmospheric lead to compare neighborhoods and states. Lead was a strong predictor of assault rates 21 years later. An increase in atmospheric lead of 1 microgram per cubic meter led to an increase in assault rates of 163 per 100,000 population.
2017, Beckley et al.: A prospective study of children in Dunedin, New Zealand, provides support for the lead-crime hypothesis, but only modestly. This is unsurprising since New Zealand generally had fairly low levels of lead poisoning to begin with.
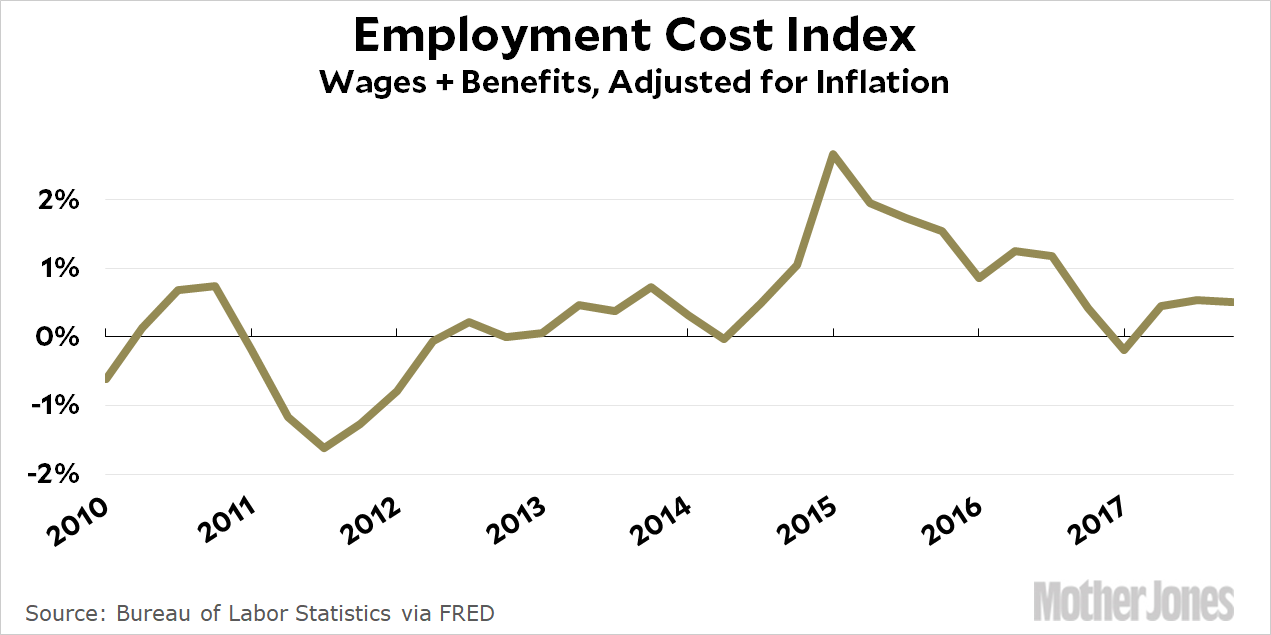
Is the economy getting close to full capacity? Arguing for the affirmative is the unemployment rate, which is very low. Arguing for the negative is the inflation rate, which is also low. If the economy were truly running at capacity, companies would be bidding up prices for workers and inflation would be climbing. But it’s not. For example, here’s the annual growth of the Employment Cost Index, which measures both wages and benefits:
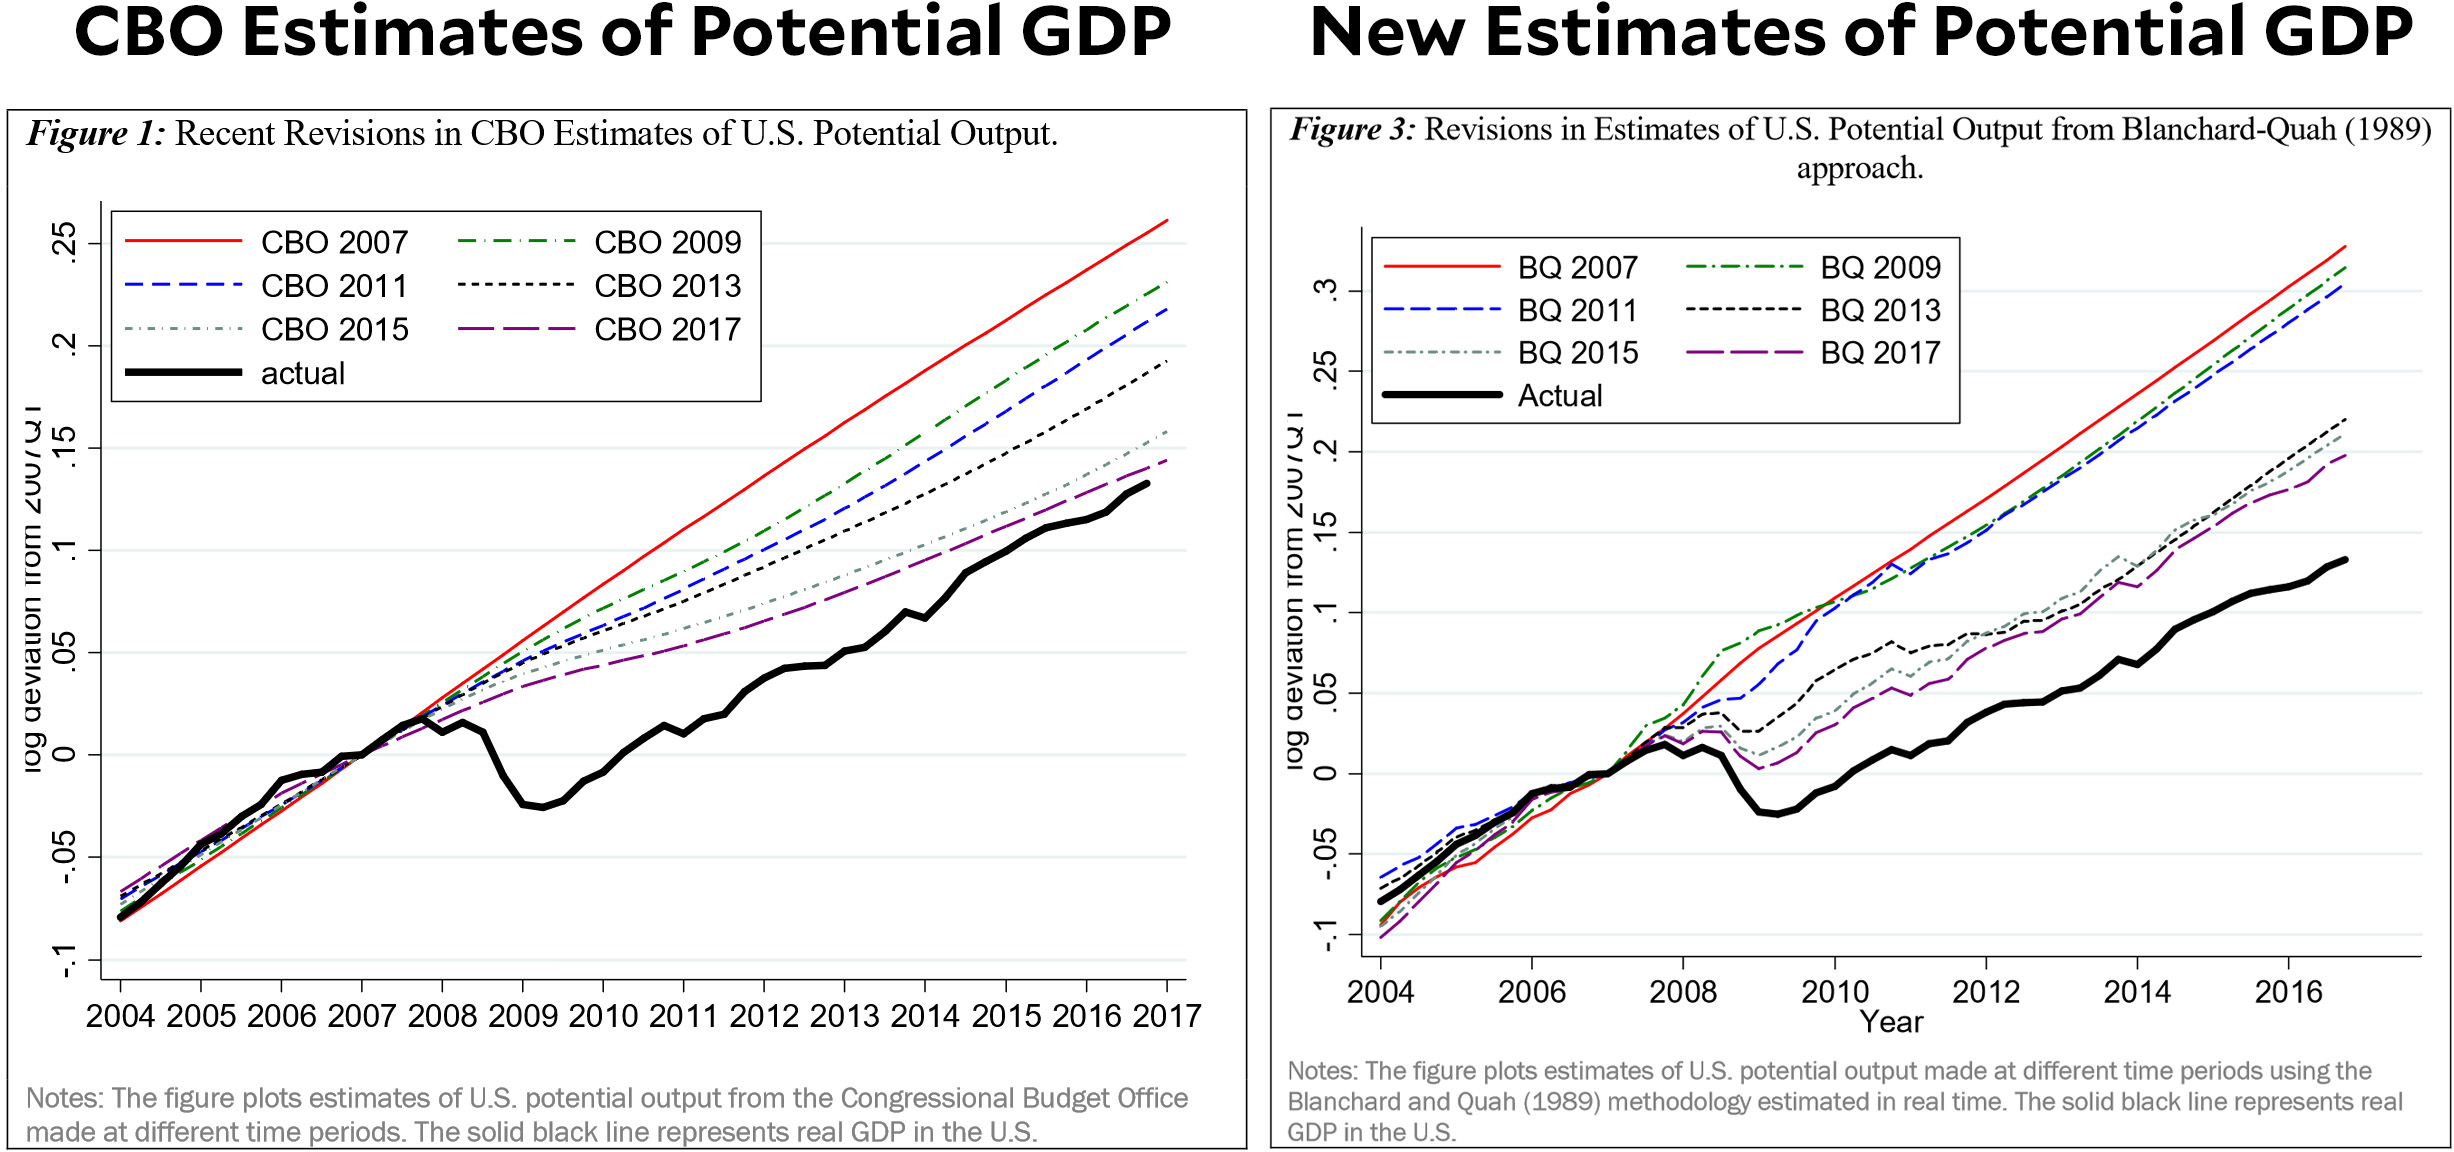
The ECI isn’t growing much faster than inflation, which means it’s barely putting any upward pressure on wages and prices. What’s more, it’s been decelerating for the past three years. So why does everyone think that the economy is running at full capacity, with GDP bumping right up against potential GDP? Jared Bernstein points to a new paper that suggests the problem is with the way potential GDP is being calculated. The Congressional Budget Office has been lowering its estimates for years, but the authors of the paper think they’ve lowered it too much:
They borrow a statistical method from a paper by Blanchard and Quah that they claim does a better job separating out temporary and permanent shocks to the economy.
….Here’s why that’s so important. Suppose the economy gets whacked by a negative shock like the bursting of a credit bubble. A bunch of people temporarily leave the labor market. A bunch of firms cut back on their investment. Recession ensues. That’s a classic, temporary demand shock. The fundamental supply factors that drive long-term economic growth—labor supply, innovation, the amount of capital per worker—haven’t been permanently thrown off course. Once balance sheets recover and credit flows resume, the economy should make up its losses and revert back to its previous growth rate.
Contrast that with a permanent supply shock, like the one with which we and some other advanced economies are currently dealing: an aging population….that lastingly slows the long-term growth of the labor force and thus lowers potential GDP.
The problem that [the authors] document is that current statistical methods employed by the Fed, CBO, and others conflate these two types of shocks, often mistaking temporary downgrades for permanent ones. That, in turn, leads policy makers, like those meeting across town as we speak, to underestimate the size of potential GDP.
Needless to say, I won’t pretend to have the chops to comment on the technical issues here. But it’s a serious paper, and if the authors are right it would solve one of the paradoxes of the current economy: the reason inflation isn’t picking up yet is because the economy isn’t close to its current capacity yet.
If this is true, however, it opens up another question: what’s wrong with the headline unemployment figure? It’s currently running at 4.1 percent, which should signify a very tight labor market. In the past it certainly has. So why isn’t it doing so now?
A marijuana consultant helps a customer at a San Diego dispensary on January 1, the day pot became legal in California.Brian Cahn via ZUMA
States can legalize marijuana all they want, but it’s still a federally prohibited Schedule I drug. This presents legal marijuana dealers with a problem: where do they keep their money? Banks are under federal supervision, and few of them want to take the chance of knowingly accepting drug money that might later get them in trouble with the feds. California, as always a bellwether for the nation, thinks it might have an answer:
California’s treasurer and attorney general will study whether the state should create its own publicly owned bank to serve the state’s now-legal cannabis industry….There are numerous obstacles to creating such an institution, especially if the plan is for the bank to openly work with cannabis companies.
….[John] Chiang and other public officials have said the lack of banking access for cannabis companies, which has left the industry largely reliant on cash, poses public safety risks and makes it more difficult for the state and local agencies to monitor the industry and ensure businesses are paying their taxes.
A pot bank! I am hereby opening the floor to proposed names for our new bank.
The Washington Post has a story today about a “listening tour” that Ben Carson set up in Baltimore a few months ago. It seems odd that Carson felt he needed to learn more about Baltimore, considering that he worked there for more than 30 years and has lived in the area for practically his entire adult life. But he did. And he asked his son to help out by inviting some of Baltimore’s corporate movers and shakers.
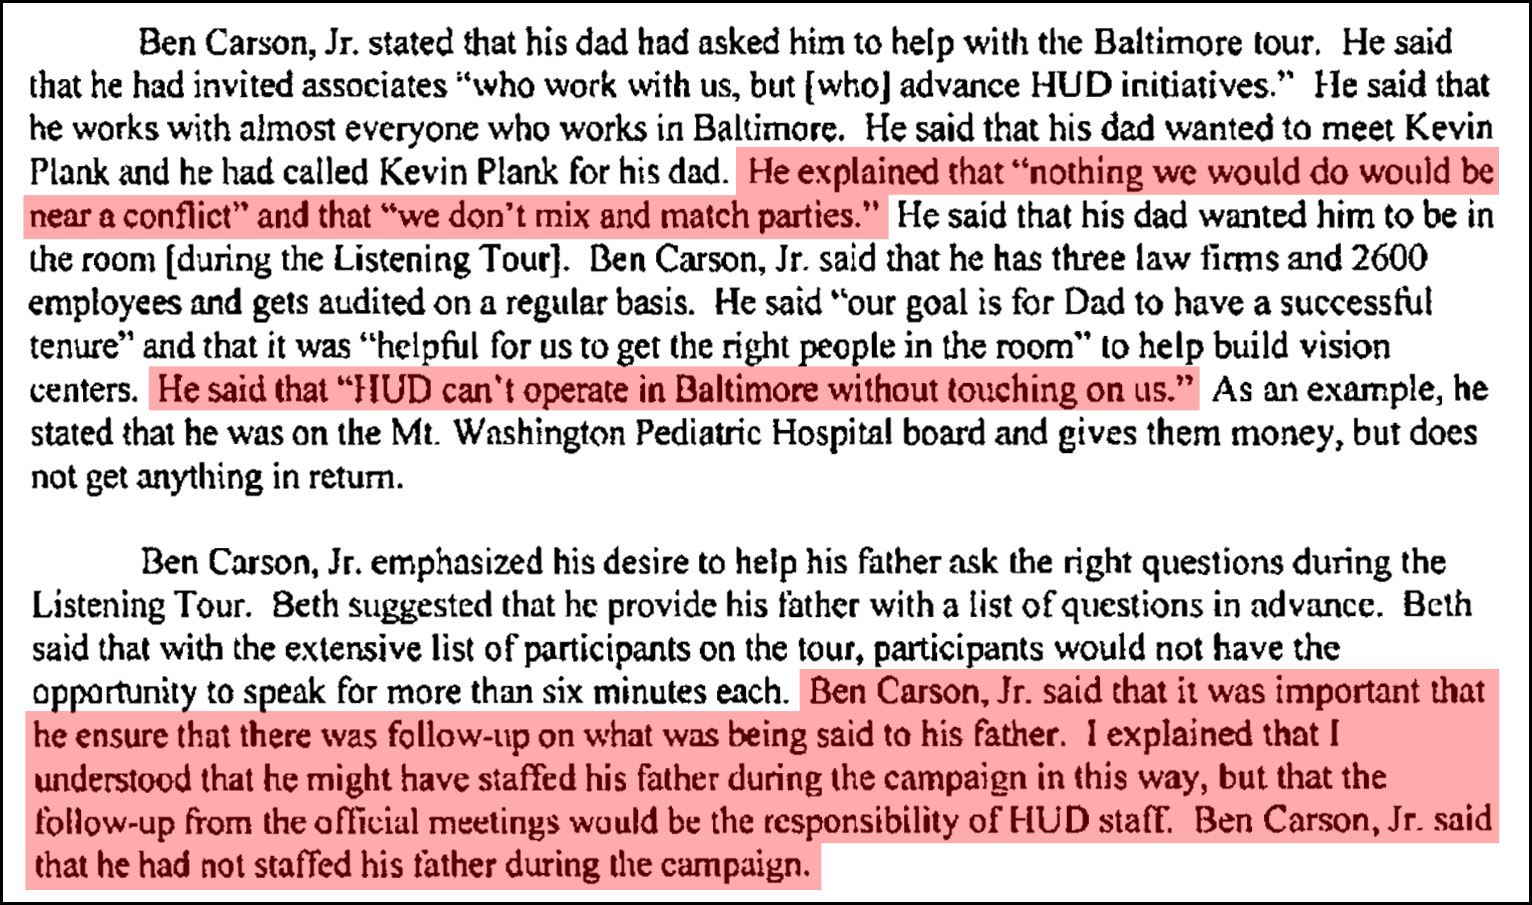
This caught the attention of HUD’s chief lawyer, who worried that it set up a pretty obvious conflict of interest. After all, Ben Carson Jr. owns a company that does a lot business in Baltimore, and letting him handle the invitation list made it look like a government event was benefiting the son of the HUD secretary. Now, this is not the biggest deal in the world. But the part that truly dumbfounded me was this section of the memo, where HUD General Counsel Linda Cruciani describes the phone call they had with Ben Jr.:
The breathtaking thing about this is that Ben Jr. seems entirely unable to understand how this could even be a problem. No worries, folks: I just want dad to do well and I’d never use one of his events to schmooze with potential clients. So we’re all good, right? This despite the fact that Ben Jr. acknowledges that his business is deeply intertwined with HUD, and potential clients would certainly be impressed if they thought his company could put in the occasional good word with the secretary when they had HUD business. And there’s more:
The high-level meetings surrounding the Baltimore event highlight the extent to which Carson has relied on close family members since joining the Cabinet. His wife, Candy Carson, son Carson Jr. and daughter-in-law Merlynn Carson have attended some of his official meetings, according to current and former HUD officials….Candy Carson, Carson Jr. and Merlynn Carson attended multiple events during the Baltimore tour, including ones open to the news media and a closed-door session on housing policy with state and city officials along with HUD employees, according to a person with knowledge of the matter who spoke on the condition of anonymity.
Jereon Brown, a HUD spokesman, confirmed that Carson Jr.’s role was not limited to the health-care discussion. He said no one was dropped from the list of invitees. He did not respond to questions about what steps, if any, the secretary took to address the ethics warnings that department lawyers raised.
I’d normally say that this is another example of how Donald Trump’s ethical standards have seeped into Washington DC, but let’s face it: Ben Carson has been grifting since way before he ever met Trump. It’s not that he’s learned something new from Trump. He just fits in really well.
You have to give Republicans credit: as political theater, the Nunes memo has been sensational. If Devin Nunes had just written his memo and released it, no one would have cared. Adam Schiff would have gone on TV to denounce it, and by the next day it would have been forgotten. But no. That’s not what happened. Here’s how the launch plan has marched forth:
Nunes writes memo.
But it’s based on classified info and “can’t be released.” Everybody loves secrets, so that gives the memo an extra cachet.
Nunes makes it available for reading, but only to members of Congress and only in a secure location. Ooh!
Lots of Republicans read it, so it generates lots of chatter—and a few carefully calibrated leaks so the press will write about it. The Washington press corps absolutely can’t resist a leak.
Needless to say, Fox News is giving the memo 24/7 coverage throughout the entire marketing rollout.
Trump starts tweeting about how the memo will blow the Russia investigation out of the water.
Nunes threatens to release the memo regardless of whether it’s officially declassified. This naturally provokes a partisan fight, and just as naturally that has to be covered. It’s news!
Adam Schiff is provoked into writing a dissenting memo.
Republicans vote to release the Nunes memo regardless of its sources.¹ This is the first time any intelligence committee has done this, so naturally it’s news.
The vote leaves the final decision on release up to President Trump. He has five days to decide, which means five more days of news.
Then we get the usual Trump show. Will he release it? Or won’t he? Has he tweeted about it? What did he tell that congressman, anyway? All the world wants to know.
The FBI chimes in. The memo is shoddy and wrong. News!
And that takes us up to today. Presumably Trump will release the memo, but if he doesn’t it hardly matters. Someone would just leak the whole thing to make sure it gets into the press. In fact, it might even be more newsworthy if Trump pretends to withhold the memo because it’s based on sensitive intelligence. That would add to the memo’s authority and whet the public’s appetite even more for the eventual leak.
All of this for a memo that’s a nothingburger. What’s more, I’ll bet everyone in the DC press corps knows it’s a nothingburger. They already know roughly what’s in the memo, and they also know that Nunes is a singularly untrustworthy actor. But there’s nothing they can do about it. They know they’re being worked, but they go along anyway. We are all lemmings.
Almost half of Americans who watched President Donald Trump’s first State of the Union address — 48% — say they had a “very positive” impression of the speech….It’s the lowest net positive rating for a State of the Union address since at least 1998, when CNN first asked the question. There is no equivalent poll for addresses before 1998.
The poll was conducted among a group of Americans who said in prior interviews that they planned to watch the speech and were willing to be contacted after its conclusion. People who choose to watch a political speech tend to be more supportive of the speaker than the general population; this sample was about 7 points more Republican than the entire American population.
I’m actually a little surprised by this. Liberal political junkies like us hated it, of course, but to the average ear I figured it sounded fairly conciliatory. Trump said he wanted to work with everyone, and the dog whistle stuff (standing for the national anthem, “Americans are dreamers too,” illegal immigrants are all killers and gang thugs) probably didn’t make much of an impression. And there were lots and lots of inspiring American heroes.
So if the speech got a weak reception, there are two alternatives. The first option is that average folks are pretty sophisticated and they understand insincerity and dog whistles as well as we do. The second option is that Republican-leaning audiences want red meat and they were disappointed not to get more of it.
In any case, this is another example of Trump picking and choosing what he says for different audiences. His tweets are aimed solely at his true-believer base. That’s why they’re so nuts. The SOTU is aimed at everyone, especially those who don’t pay much attention to politics and are tuning in for the first time in a while to see how Trump is doing. That’s why it was low key.
And Joe Kennedy’s response? It was red meat all the way. He probably figured—correctly—that hardly anyone watches the response except for diehard members of the opposition party, so that’s who it should appeal to.
The Baltimore Police Department is currently in court over one of the biggest scandals in the history of American law enforcement. You want robbery? How about the story of the corrupt squad stopping a drug dealer during a traffic stop and robbing him of $6,500, then going to the man’s home without a warrant and taking another $100,000 out of a safe?
Maybe you should read about how Maurice Ward had a technique of driving fast at groups of people, slamming on the brakes and chasing whoever ran. Perhaps you hear how [Wayne] Jenkins believed that all young men with backpacks were dope boys. Or people who drove Honda Accords with tinted windows. And then there’s the revelation that the supervisor of the [elite Gun Trace Task Force] instructed officers to carry a toy gun just in case they found themselves “in a jam” and needed to plant one. When one of the officers, Marcus Tayor, was arrested, officials couldn’t figure out why he had a toy gun in his glove compartment.
That’s from Michael Harriot at The Root. It’s mostly based on reports in the Baltimore Sun, which passes along reaction from the black community:
Christopher Ervin, who founded the re-entry group The Lazarus Rite, said the Gun Trace Task Force allegations are “shocking for people who don’t live in those communities.”
“In the black community, this is not shocking at all,” Ervin said. “You get a chorus of, ‘We’ve been saying that.’ ”
All by itself this is a huge scandal, of course. But what do you think are the odds that dozens or hundreds of other officers knew all about this and never said a word? That’s the no-snitch culture at work. These folks always have one grievance after another, but they have only themselves to blame for making it so hard to clean up the police community and make it safe for everyone.
My tripod sucks. But do I really want to spend a ton of money for a new one?
However, my beanbag came through. Yay beanbag!
There are too many damn trees in my neighborhood.
As usual my camera’s resolution at full zoom is terrible. But is this the lens or the aggressive JPEG processing? I took a bunch of pictures in RAW mode, and if I ever upgrade Photoshop to handle my camera’s format I’ll find out.
Still and all, I got pictures. Not great pictures, but they show what things looked like here on the West Coast. Here they are.
1. Moonrise, nine hours before the eclipse. 5:27 pm PST.
2. The start of the eclipse. 4:22 am PST.
3. Nearly full. 4:57 am PST.
4. Totality. 5:26 am PST.
5. Coming out of totality as the morning sky starts to lighten. 6:02 am PST.
Billionaires own the media,
but they don’t own us.
At Mother Jones we know these aren’t conventional times, and they require unconventional coverage. That’s what deliver every day: fierce, independent journalism you can’t find elsewhere. Perhaps never in the history of our country has that been more necessary than now. But we can’t do it without reader support—your support. Please chip in today.